Apps chineses impulsionaram 85% da aquisição de usuários no iOS – +10% em relação ao ano anterior
As novas tarifas de 2025 levaram a uma mudança significativa nos orçamentos, que passaram a ser mais investidos na Europa Ocidental. O gasto total com aquisição de usuários em 2024 chegou a 4,6 bilhões de dólares, dos quais 1,4 bilhões foram investidos nos EUA.
State of eCommerce App Marketing – Edição 2025
Com a participação de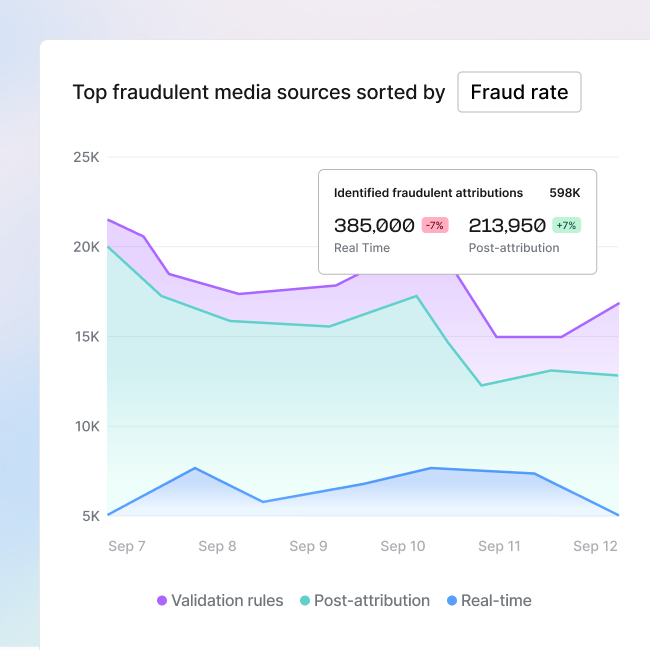
Destaques
Gasto em remarketing atingiu US$16,4 bilhões em 2024, +3,5 vezes do que o gasto com aquisição de usuários
Em 2025 (janeiro-maio), os orçamentos de remarketing cresceram 29% em relação ao ano anterior, impulsionados por um salto de 42% em investimentos no iOS. Durante o pico da temporada de 2024, o remarketing representou 86% do total de orçamentos no iOS (incluindo aquisição de usuários), um aumento de 61% comparado a novembro de 2023.
No iOS, a receita de compras in-app subiu 10% em 2025, em comparação com o ano anterior
Enquanto o gasto dos consumidores no Android teve um aumento de apenas 6% entre janeiro e maio, no iOS vemos uma tendência mais forte e consistente. A Índia se destacou, com um aumento de 44% de gastos no iOS em novembro, enquanto o Brasil e a França registraram quedas no Android.
O iOS se destaca em velocidade de conversão e fidelização de clientes
Os usuários do iOS convertem 1,3 dias mais cedo do que usuários do Android, com uma taxa de primeira compra 39% maior e uma performance de novas compras 68% maior – ou seja, a segunda conversão ocorre de forma mais rápida.
38% de aumento em instalações geradas por web-to-app antes da temporada de pico
Entre setembro e novembro de 2024, as empresas apostaram mais em mídias próprias, usando smart banners em seus sites para impulsionar instalações e reengajamento. Observamos outro aumento de 37% nos meses de março a junho de 2025.
Até 1 bilhão de dólares expostos à fraude de instalação
Observamos uma grande variação nas taxas de fraude: no iOS, a taxa chegou a mais de 30% no final de 2023, antes de cair para 25,9%. Já o Android permaneceu mais estável, mas subiu em regiões como o Brasil. Adotar táticas específicas, focadas individualmente em cada plataforma, são fundamentais para reduzir riscos.
Introdução
iOS e remarketing crescem em meio a uma perspectiva ainda indefinida para Q4
Em 2025, o app marketing na vertical de eCommerce está sendo impactado por várias mudanças, algumas estratégicas e outras circunstanciais. Uma delas é o novo foco dos orçamentos de aquisição de usuários dos aplicativos chineses.
Esses apps dominam cada vez mais as instalações no iOS e recentemente passaram a investir esses esforços na Europa Ocidental, deixando os EUA de lado. Já nos EUA, as pressões das tarifas tornaram a aquisição menos atraente, levando a um aumento nos investimentos em países como Alemanha, França e Reino Unido.
Com isso, também observamos uma alteração nas estratégias das campanhas. Em 2024, muitos profissionais de marketing buscaram adquirir usuários bem antes da temporada de festas de final de ano e depois se concentraram no remarketing durante o quarto trimestre. Esse padrão pode se repetir em 2025, especialmente em meio à volatilidade do mercado e mudanças no comportamento dos consumidores.
O remarketing ainda é uma das principais alavancas para gerar lifetime value, especialmente em mercados onde a reativação é mais eficiente do que a aquisição. Ao mesmo tempo, as jornadas dos usuários se espalham cada vez mais por diferentes plataformas. Entre a web e o app, os profissionais de marketing estão conectando touchpoints de forma mais fluida para reduzir a fricção e melhorar a conversão.
O iOS também se destaca em todos os níveis de performance, impulsionando taxas de conversão e fidelização mais altas, um tempo de compra mais rápido e um crescimento mais forte em compras in-app. Com isso, essa plataforma continua sendo uma prioridade, mesmo que os custos por conversão sejam de três a quatro vezes mais altos do que no Android.
Há a expectativa de que os gastos dos consumidores aumentem de forma moderada durante as festas de fim de ano. Os usuários estão se planejando mais cedo e se tornando mais seletivos. Ao mesmo tempo, a distribuição geográfica dos orçamentos de marketing continua intrinsecamente ligada às condições macroeconômicas, trazendo uma incerteza que exige planos de emergência.
Em resposta, muitas marcas estão usando IA para otimizar seu ritmo, criativos, segmentação e remarketing, ajudando suas equipes a responder mais rápido e operar de forma mais eficiente.
Para ajudar com o planejamento estratégico para os próximos meses, a edição de 2025 do State of eCommerce App Marketing analisou 4,2 bilhões de dólares em gastos com mídia e revela tendências exclusivas.
Amostra de dados *
1.600
Aplicativos de eCommerce (excluindo marketplace e supermercados) com pelo menos 3.000 instalações por mês, por país
29B
Conversões de marketing, incluindo 26 bilhões de conversões de remarketing e 3 bilhões de instalações pagas de outubro de 2023 a maio de 2025 (dados inclusivos).
US$4,2B
Gastos com anúncios por apps de eCommerce, incluindo aquisição de usuários e remarketing, entre outubro de 2023 e maio de 2025 (dados inclusivos).
* Todos os resultados se baseiam em dados totalmente anônimos e agregados. Para garantir a validade estatística, seguimos rigorosos limites de volume e metodologias específicas. Assim, somente apresentamos dados que correspondem às condições estabelecidas. Nos dados padronizados, a porcentagem de cada mês em relação ao total de todo o período cria uma tendência.
Tendências
Apps chineses intensificam a aquisição de usuários no iOS, transformando o padrão de investimento global
No eCommerce, aplicativos chineses continuam a dominar o investimento em anúncios de instalação de aplicativos no iOS. Considerando que a plataforma recebe de 20% a 30% mais orçamentos de aquisição do que o Android, apesar do seu market share menor, essa é uma tendência especialmente significativa. Entre outubro de 2023 e maio de 2024, aplicativos chineses impulsionaram 77% da aquisição de usuários global no iOS. Um ano depois, essa porcentagem subiu para 85%.
Esse salto é consequência de uma mudança significativa no foco desses investimentos, que deixaram de focar nos EUA e passaram a se concentrar na Europa Ocidental, um movimento impulsionado principalmente pela pressão tarifária dos EUA. Mais especificamente, os EUA cancelou a isenção de minimis que permitia que pacotes com um valor menor do que 800 dólares entrassem no país sem se sujeitar a tarifas.
Desde que as novas tarifas foram impostas, os investimentos em aquisição de usuários de iOS no país tiveram uma queda de 32%, enquanto no Reino Unido, Alemanha e França observamos um salto de 7 vezes. Ou seja, a China está se afastando de mercados caros e saturados e investindo em mercados com uma presença forte de iOS.
A estratégia é escalar através de preços baixos, investimentos pesados em mídia e experiências personalizadas. A automação de campanhas usando IA e testes de criativos também agilizou a localização e a implementação em escala. Em resposta, marcas tradicionais de eCommerce estão ajustando suas estratégias: expandindo linhas de orçamento, melhorando a experiência do usuário, fortalecendo a lealdade e explorando novos canais de mídia.
Em novembro de 2024, a aquisição de usuários no iOS disparou em mercados dominados pelo Android:
- Brasil: iOS +481%, Android −22%
- Índia: iOS +70%, Android +24%
- México: iOS +21%, Android −21%
Enquanto isso, os EUA registraram uma queda acentuada no pico de vendas em novembro: queda de 38% na aquisição de usuários no iOS e de 32% no Android. Muitos aplicativos chineses já haviam aumentado seus esforços de aquisição de usuários em julho, com o objetivo de evitar os picos de aumento no custo por instalação e aumentar o foco em remarketing em Q4.
A Indonésia também se destaca: com um aumento de 43% na aquisição de usuários no Android em novembro de 2024 em comparação com o ano anterior e de 67% no período de janeiro a maio de 2025. Isso reflete um investimento renovado em mercados volumosos e mais baratos.
Investimento em anúncios voltados para a aquisição de usuários em 2024, por plataforma (em milhões de dólares) *
* O investimento total é calculado a partir da modelagem de dados de custo recebidos pela AppsFlyer, considerando os dados de market share para cada vertical e país (Sensor Tower) para criar uma estimativa final.
O investimento em remarketing cresce rápido e a retenção se torna prioridade
O remarketing continua sendo a espinha dorsal para o crescimento dos aplicativos de eCommerce, e ele está crescendo em todas as plataformas e regiões. Em 2025 (jan-maio), os orçamentos de remarketing tiveram um aumento de 29% em relação ao mesmo período no ano anterior, impulsionados por um salto de 42% no iOS (e 16% no Android).
Em Q4, mais especificamente em novembro e dezembro, quando a competição pela atenção dos usuários aumenta, o reengajamento também foi uma estratégia de destaque.
Aplicativos chineses, que já estavam dominando a aquisição de usuários no iOS, intensificaram o remarketing globalmente. Em novembro de 2024, o investimento em remarketing teve um salto de +218% nos EUA, +220% na Alemanha, +330% no Brasil e +136% no México.
Esse crescimento não se limitou ao iOS. Na verdade, esses aplicativos aumentaram em +230% o investimento em remarketing no iOS e em +100% no Android, adotando uma abordagem mais equilibrada em comparação com os investimentos em aquisição.
Em 2025, a mudança nas tarifas mais uma vez impactam a distribuição de orçamentos de remarketing na China. Houve uma queda nos investimentos nos EUA, especialmente no iOS, e um aumento na Europa Ocidental e em LATAM. O iOS liderou o crescimento, mas o Android não ficou de lado, marcando uma mudança estratégica em direção a mercados escaláveis, que oferecem um alto rendimento.
Os EUA continuam sendo o maior mercado para remarketing, concentrando 6,67 bilhões de dólares gastos em 2024. Embora os aplicativos dos EUA ainda liderem em volume, os players chineses agora representam mais de 2,3 bilhões de dólares em investimentos em reengajamento na região.
A Índia também se destacou. No início de 2025, o gasto com remarketing atingiu 447 milhões de dólares, sendo que 99,7% desse valor veio de aplicativos da própria Índia, o que mostra o forte foco do país em reter usuários locais.
A IA também desempenhou um papel importante nessa mudança. Os profissionais de marketing usam cada vez mais a IA para segmentar audiências, acelerar esforços e configurar seu bidding para otimizar o remarketing.
Com o aumento nos custos de aquisição e um reengajamento cada vez mais eficiente, o remarketing deixou de ser apenas uma ferramenta de retenção. Ele se tornou um motor de crescimento e, para muitos aplicativos, ele é a base da performance de longo prazo.
Investimento em anúncios de remarketing em 2024, por plataforma (em milhões de dólares) *
* O investimento total é calculado a partir da modelagem de dados de custo recebidos pela AppsFlyer, considerando os dados de market share para cada vertical e país (Sensor Tower) para criar uma estimativa final.
Orçamentos de aquisição e remarketing se estabilizam entre regiões
Ao longo de 2024, o remarketing dominou os orçamentos em ambas as plataformas, mas principalmente no iOS. Isso reflete o aumento no foco no lifetime value dos usuários, posicionando o remarketing como uma base estratégica para aplicativos de eCommerce.
Os meses de novembro e dezembro confirmaram essa tendência. Em novembro de 2024, o investimento em remarketing no iOS teve um aumento de 41% em relação ao ano anterior, representando 85% do orçamento total do iOS (um aumento impressionante de 61%). No Android, observamos um aumento de 71% para 79%. Durante o Dia dos solteiros e a Black Friday, os profissionais de marketing focaram na retenção, evitando o custo elevado de aquisição durante a temporada de pico.
Em 2025, observamos alguns sinais que apontam para um reequilíbrio. Entre março e maio, o investimento em aquisição de usuários no iOS teve um aumento de +52% em relação à média de 2024, resultando em um salto total de 27%. Esse dado segue a tendência da volta das atividades de aquisição, principalmente por parte de aplicativos chineses com foco em Alemanha, França e Reino Unido.
No geral, as dinâmicas regionais variam:
- A Europa Ocidental viu uma recuperação nas atividades de aquisição após um quarto trimestre de 2024 focado principalmente no remarketing.
- Nos EUA, o remarketing permaneceu dominante.
- Na Índia, mais de 99% dos investimentos em remarketing veio de aplicativos locais, enquanto os volumes de aquisição de usuários permaneceram baixos.
- No Brasil, a aquisição de usuários continuou estável mesmo com o avanço do remarketing.
Divisão do investimento em anúncios por tipo de atividade *
* Entre apps com um valor mínimo de investimento em aquisição e remarketing.
Instalações pagas lideram o crescimento, mas não em todos os mercados
Em 2025, as instalações pagas tiveram um crescimento geral na maioria dos mercados nos quais os aplicativos de eCommerce têm uma presença forte. Países como Brasil, França, Alemanha e Índia se voltaram mais para campanhas pagas.
Já os EUA quebraram esse padrão. Em novembro de 2024 e início de 2025, os EUA investiram mais em campanhas orgânicas, o que reflete um ecossistema no qual as marcas que investem em fidelização e a visibilidade observam mais resultados positivos, sem precisar investir tanto em mídias pagas.
Durante a temporada de festas de final de ano, as instalações pagas dispararam em alguns dos principais mercados — com um salto de +155% no Brasil e +76% na Índia — enquanto as instalações orgânicas permaneceram estáveis ou diminuíram. Isso destaca a dominância da aquisição impulsionada por mídias pagas durante o pico sazonal.
Analisando apenas o mês de novembro, observamos um aumento em esforços de aquisição paga logo em setembro e outubro, seguido por um salto de 33% globalmente. As tendências de cada país varia:
- A Alemanha teve um crescimento constante ao longo do quarto trimestre.
- O Brasil atingiu seu pico em novembro.
- Na Índia, esse aumento começou em outubro.
Observamos um padrão familiar: o investimento em aquisição começa cedo, o foco muda para o remarketing durante as festas e então o reengajamento se torna prioridade no primeiro e segundo trimestres do ano.
Em 2025, mercados que costumam investir em aquisição paga dobraram esses esforços, principalmente por conta dos investimentos de aplicativos chineses. A discrepância entre mercados liderados por esforços pagos e orgânicos aumentou ainda mais.
Tendências de instalação por tipo e plataforma (padronizadas)
iOS impulsiona um aumento em compras in-app e o Android fica ligeiramente atrás
As tendências de compras in-app de 2024 e início de 2025 revelaram algumas discrepâncias em nível de plataforma. O iOS liderou, registrando um aumento de 10% em compras in-app, em comparação com o aumento de 6% no Android. Essa diferença reflete o valor do usuário, o contexto econômico e a força da monetização.
No iOS, a Índia se destacou: com um aumento de 44% em novembro de 2024 e de 31% entre janeiro e maio de 2025. Embora o iOS represente uma pequena parcela do mercado, estratégias de aquisição e retenção de usuários de alto valor estão se tornando cada vez mais importantes.
Globalmente, o iOS teve um crescimento constante em compras in-app durante o período de festas. O Android teve um resultado mais misto. Em novembro, os investimentos tiveram uma queda de 32% no Brasil e de 30% na França. Em contraste, os EUA permaneceram estáveis, com investimentos em compras in-app inalterados em novembro, para depois subir em 2025: +7% no iOS, +4% no Android.
O Reino Unido teve resultados fortes: +12% (iOS) e +15% (Android) em novembro, em uma tendência que se sustentou entrando em 2025.
No Brasil, a receita de compras in-app do Android caiu 28% em 2025, apesar do forte investimento em aquisição de usuários. Incertezas econômicas e pressões cambiais estão forçando uma mudança gradual em direção ao iOS.
Embora os esforços pagos de aquisição de usuários tenham sido responsáveis pelo aumento nas instalações em 2025, a tendência de compras in-app seguiu um padrão claro. Assim, vemos que o valor de um usuário é moldado pela economia das plataformas e por condições locais, não só pelo volume de aquisição.
Receita de compras in-app por plataforma (padronizada)
Fidelidade e compras repetidas
Nem todas as conversões são iguais. Embora muitos usuários façam a primeira compra logo após a instalação (normalmente por conta de uma promoção ou incentivo) a segunda compra é um sinal mais duradouro da confiança, intenção e do começo da fidelização.
Entre janeiro e maio de 2025, a conversão de usuários regulares no iOS foi de cerca de 11%, em comparação com 7,9% no Android, resultando em uma diferença de 39% entre as plataformas. A diferença em usuários fidelizados foi ainda mais marcante: o iOS teve uma média de 4,7%, enquanto o Android registrou uma média de 2,8%, resultando em uma diferença de 68% em engajamento mais profundo.
Nesse quesito, vários mercados se destacaram. Na Indonésia, a fidelização no iOS ficou 70% acima da média global, enquanto a Coreia do Sul superou essa média em mais de 60%. No Android, a taxa de usuários fidelizados do Japão foi 80% acima da média da plataforma, seguido pela Coreia do Sul e Arábia Saudita.
Nos EUA, o iOS liderou em conversões como um todo, mas os usuários do Android mostraram uma maior probabilidade de fazer novas compras. A proporção entre usuários fidelizados e usuários regulares foi 22% maior no Android, o que indica um forte potencial de reengajamento nessa plataforma, mesmo em mercados onde o iOS domina na aquisição.
A IA está começando a ajudar com esses esforços. Analisando sinais de comportamento inicial, é possível identificar quais usuários têm mais chances de ter uma nova conversão. Esses insights ajudam a melhorar a modelagem e a segmentar campanhas de follow-up com mais eficiência.
A segunda compra é mais do que uma métrica: ela marca uma transição-chave no comportamento do usuário, que vai de conversão de curto prazo para um valor de longo prazo.
Porcentagem de usuários que fazem compras, separados por tipo de retenção (2025) *
* A taxa instalação-compra é a parcela de usuários que instalam um app e fazem pelo menos uma compra dentro de 30 dias; A taxa instalação-fidelização inclui usuários que fizeram pelo menos 2 compras no mesmo período. Os valores de 2025 representam a média mensal entre janeiro e maio.
Usuários de iOS convertem mais rápido e continuam fazendo compras
As tendências de relação tempo-compra mostram que usuários de iOS monetizam mais rápido do que usuários de Android, com uma média de 1,3 dias para a primeira compra, uma tendência que também se aplica à segunda e terceira transações. Nesse caso, fluxos mais simples e um LTV maior provavelmente desempenham um papel importante.
A diferença é mais acentuada no Japão e na Coreia do Sul, onde os usuários de Android são de 1,5 a 2,5 dias mais lentos para converter.
O Brasil é a exceção: a relação tempo-compra é quase idêntica entre as plataformas, provavelmente devido à dominância do Android e à forte infraestrutura de pagamento local.
Usuários de iOS também fazem uma nova compram mais cedo, além de terem uma velocidade de compra repetida mais rápida. Tudo isso favorece a monetização.
Em contraste, os usuários do Android têm mais chances de desistir de uma compra. Enquanto as primeiras compras acontecem em um ritmo razoável, a conversão repetida desacelera significativamente, sugerindo um comportamento mais cauteloso e um reengajamento mais complicado.
Tempo entre a instalação e a compra (cumulativo) *
* Número de dias após a instalação. Por exemplo: na Arábia Saudita, o tempo médio que passa entre a instalação e a compra no iOS é de 2,49 dias para a primeira compra, 3,58 dias desde a instalação até a segunda compra (ou 1,08 dias entre a primeira e segunda compras), etc.
Fluxos web-to-app se tornaram fundamentais
A atividade web-to-app cresceu significativamente em 2024 e no início de 2025. De setembro a novembro, o tráfego aumentou +38%, com mais um salto de +37% entre fevereiro e maio de 2025.
Esses dados apontam para uma maior adoção de banners e prompts nos sites, que usam smart linking para incentivar os usuários a baixar ou acessar o app (reengajamento).
Esses fluxos são simples e eficazes, oferecendo uma rota com menos fricção e impulsionando mais conversões.
Os dados da AppsFlyer mostram que usuários que chegam a um app através do web-to-app têm taxas de instalação-ação e LTV muito mais altas do que aqueles adquiridos através de canais tradicionais.
Instalações via web-to-app (padronizadas) *
* A tendência de crescimento em instalações de apps por usuários que clicaram em um banner para instalar o app no site da empresa.
Ameaças de fraude persistem e as táticas evoluem
A fraude de instalação continua sendo uma ameaça persistente na vertical de eCommerce. Entre outubro de 2023 e maio de 2025, as taxas de fraude no iOS caíram de 30,1% para 25,9%, mas observamos alguns picos durante períodos de atividade de aquisição mais intensa. O Android permaneceu mais consistente, com um aumento ligeiro de 9,4% para 10,5% em fraude.
O pico do iOS em 2025 provavelmente reflete campanhas agressivas de aquisição por aplicativos chineses. Quando a aquisição acelera e o foco em performance se intensifica, a exposição à fraude também costuma aumentar.
As táticas fraudulentas não estão desaparecendo, estão mudando. No Brasil, a fraude no Android é dominada por flooding de cliques e tráfego de publishers falsos. Em outras regiões, bots e hijacking de instalação são mais comuns. No geral, vemos uma variação mais acentuada entre mercados.
Os fraudadores estão usando IA para automatizar ataques e se adaptar aos métodos de detecção, mas o mercado está respondendo. Modelos avançados de machine learning estão sendo usados para sinalizar anomalias, classificar o tráfego em tempo real e identificar novos padrões de ataque antes que eles se espalhem.
A inovação em fraudes está acelerando, assim como a necessidade de inovar em resposta, pois o impacto financeiro é significativo. Somente nos EUA, fraudes que não foram bloqueadas teriam custado 179 milhões de dólares no iOS e 98 milhões de dólares no Android. Globalmente, a exposição a fraudes em aplicativos de eCommerce está se aproximando da casa do 1 bilhão de dólares.
No entanto, não existe uma única abordagem que funcione para todos. Uma proteção eficaz é aquela que se adapta a ameaças locais e que possui sistemas de defesa personalizados de acordo com o comportamento nas plataformas.
Exposição financeira à fraude de instalação por plataforma (em milhões de dólares) *
* A exposição à fraude é uma estimativa do valor financeiro da fraude presente no mercado. Ou seja, esse valor não representa perdas reais causadas por atividades fraudulentas. Ele é calculado através da multiplicação do número de instalações fraudulentas identificadas pelo custo por instalação, considerando os dados de market share para cada vertical e país (Sensor Tower) para criar uma estimativa final da exposição do mercado.
Área dos especialistas


Lee Jones
Managing Director, Global App Ads Commercialization
O Lee lidera a estratégia global de publicidade de aplicativos e operações de go-to market no Google há 9 anos. Como um porta-voz convicto do mercado de aplicativos, Lee se dedica a fomentar o sucesso para desenvolvedores de apps. Graduado no Middlebury College, ele ministra diversas palestras em eventos do mercado, além de aparecer em edições da Venturebeat, AdExchanger e Think With Google.
Como você interpreta a forma como as marcas equilibram suas estratégias de aquisição de usuários e remarketing hoje — e como isso evoluiu no último ano?
As marcas de eCommerce equilibram de form estratégica a aquisição de usuários e o remarketing, focando no lifetime value (LTV). Elas reconhecem que os aplicativos são cruciais para a retenção de longo prazo, pois os usuários desses apps fazem pedidos mais caros e desenvolvem uma maior fidelidade à marca em comparação com usuários da web.
Hoje, as marcas focam na identificação e aquisição de usuários de alto valor o quanto antes no funil de aquisição, usando soluções de bidding inteligente, como tROAS (do inglês target return on ad spend) e app-conversion bidding, pois elas sabem que esses indivíduos têm mais chances de se tornar clientes fidelizados. Como resultado, vemos grandes varejistas conquistando o sucesso:
1) A adidas observou um aumento de 2,4X no ROAS de usuários do app em comparação com usuários da web em Q4 2023, implementando deep links e otimizando o bidding para compras na web e no app em campanhas de Performance Max e Search. O aumento no investimento em App Campaigns for Installs (ACi) tem como objetivo a aquisição de usuários de alto valor e o crescimento de longo prazo.
2) A G-star RAW relatou um ROAS +450% maior para campanhas de Performance Max, graças aos seus investimentos em App Campaigns for Installs (ACi).
Com o aumento da pressão por eficiência e um valor de CPI cada vez mais alto durante os picos de compras, quais práticas você recomenda para estratégias de aquisição e reengajamento?
Para impulsionar a eficiência e lutar contra custos cada vez mais elevados, uma estratégia que foca na sintonia entre a aquisição de usuários e o reengajamento é fundamental. Essas são algumas das práticas que eu recomendo:
Invista na aquisição o quanto antes: estabeleça uma base de usuários sólida antes da corrida do último trimestre para maximizar seu alcance e evitar a alta nos custos de aquisição.
Foque na primeira compra para conquistar a lealdade: crie uma experiência de onboarding memorável para estabelecer uma relação forte com o usuário logo após a primeira compra.
Integre suas campanhas: é importante entender que os esforços de aquisição e reengajamento estão interligados. App Campaigns for Installs (ACi) são muito eficientes para a aquisição, enquanto campanhas de Performance Max e Search são úteis para o reengajamento, especialmente quando conectadas via web-to-app.
Ajustes de sazonalidade: teste ajustes de sazonalidade em suas campanhas de aplicativo para informar seu bidding sobre futuros eventos que podem afetar as taxas de conversão. Esse recurso cria uma estimativa do aumento em conversões durante promoções/divulgações e inclui um modelo de “black-out learner” para a gestão de períodos de baixa, oferecendo controles de início/fim.
Como os profissionais de marketing devem adaptar suas estratégias cross-platform, particularmente considerando a evolução dos comportamentos entre plataformas (como os fluxos de web-to-app)?
É importante adotar uma abordagem holística à jornada do cliente, que se adapte aos novos comportamentos que se desenvolveram graças a essa integração entre plataformas, para garantir uma experiência conectada entre web, app e desktop. Isso é especialmente importante quando consideramos que os consumidores interagem com mais de 130 pontos de contato mobile em um único dia (Fonte: Google/Measure Protocol, Consumer Journey Analysis, US, online consumers 18+, n=370 Android users, Oct 24 – Nov 6, 2024).
Isso significa que, primeiro, é importante configurar uma mensuração que esteja conectada com os seus KPIs. Ou seja, implemente uma mensuração abrangente para acompanhar e conectar conversões do aplicativo entre plataformas.
Conecte dados internos espalhados entre equipes de web marketing e app marketing, definindo KPIs combinados. Assim, você alimenta a colaboração e constrói uma estratégia de marketing coesa.
Após uma análise do ARPU (average revenue per user) entre web e app, um cliente global de varejo teve um ROAS 10x maior e taxas de conversão 11x melhores em seu app em comparação com a web.
Em segundo lugar, é importante criar experiências diretas entre a web e o app, para atender às expectativas dos consumidores. O Web to App Connect (W2AC) é uma solução fundamental para a otimização das jornadas web-to-app, ajudando a cultivar conversões e fomentar a fidelização ao app. Os anunciantes que implementaram essa solução observaram em média uma taxa de conversão 2,8x maior em campanhas de Search e pMax.. (Fonte: Google Internal Data, Global, April 2025)
Com base no que você está vendo nos planejamentos de Q4, como os profissionais de marketing estão ajustando o timing e a mensagem das suas campanhas em meio às incertezas globais?
Os profissionais de marketing de varejo estão fazendo ajustes significativos ao timing e à mensagem das campanhas de Q4, em resposta à constante evolução nos comportamentos dos clientes.
Ajustes de timing: os profissionais de marketing estão dando início às suas campanhas cada vez mais cedo, com o objetivo de estabelecer sua base de usuários e maximizar o alcance durante a demanda do pico de compras. Os diferentes perfis dos compradores (“Early Bird,” “Evergreen,” “Deal Seeker,” “Last Minute”) influenciam a progressão de compras durante esse período, resultando na necessidade de um engajamento contínuo.
Ajustes de mensagem: os profissionais de marketing estão priorizando mensagens que destacam o valor que eles oferecem, como opções flexíveis de pagamento. Para isso, eles também estão usando a IA para, por exemplo, criar anúncios de compras que trazem detalhes ultra-relevantes, como resumos otimizados, sugestões de vídeos, comparações de preços, ofertas e velocidade de envio.
Quais são as estratégias mais eficazes que as marcas adotam para impulsionar a fidelidade e a retenção de longo prazo?
Para marcas de eCommerce, a fidelidade e a retenção de longo prazo vai além de compras repetidas, e tem como foco a experiência no aplicativo e o engajamento personalizado. Assim, essas são algumas das estratégias mais eficazes:
Certifique-se de que as suas campanhas na web façam o rastreamento de dados e conectem o bidding com as conversões que acontecem no seu app. Isso ajuda a integrar as experiências dos usuários entre diferentes canais, incentivando a fidelização no app.
Ofereça recompensas personalizadas, conteúdos exclusivos e recursos de incentivo à comunidade diretamente no app ou defina um preço específico para membros do clube fidelidade no Performance Max e Shopping para oferecer descontos personalizados com base nos tiers de fidelidade, incentivando clientes existentes a maximizar seu lifetime value (LTV).
Use os objetivos de retenção do Performance Max para otimizar campanhas e reengajar usuários de alto valor que se tornaram inativos.
Adquira clientes com um alto LTV usando o objetivo de New customer acquisition (NCA) no modo High Value. Isso permite que você faça bids mais altos para novos clientes que se parecem com seus clientes mais valiosos.
Qual é o papel da estratégia de criativos na performance da aquisição e conversão de usuários, especialmente em recursos do Google como a aba de pesquisa, YouTube e Discovery?
A estratégia de criativos é fundamental para capturar a atenção dos usuários e incentivar a ação nas diferentes plataformas do Google, principalmente em plataformas visuais como o YouTube e o Discovery, além de desempenhar um papel cada vez mais importante com os avanços proporcionados pela IA.
Anunciantes que usam assets criados automaticamente observaram em média 5% mais conversões e um custo por conversão parecido em campanhas de Search e Performance Max.
(Fonte: Google Internal Data, Search and Performance Max campaigns using automatically created assets without pinning and including Final URL expansion for Performance Max, 02/24/2024 – 03/22/2024)
Como a IA transformará estratégias de marketing durante a próxima temporada de festas e em 2026?
A IA impulsiona experiências personalizadas e campanhas otimizadas para o eCommerce, sendo responsável por transformar completamente as estratégias para 2026.
O impacto da IA vai desde a otimização de campanhas em App Campaigns for Installs, que oferece soluções cross-channel para alcançar os usuários certos, ou do AI Max para campanhas de Search, que ajudam a entender a intenção do usuário para além da análise de palavras-chave…
… Ou seja, até o desenvolvimento de criativos, a IA generativa é responsável por “impulsionar quase todas as etapas do processo criativo”, desde a ideação até a criação de novos anúncios e vídeos do zero. O Asset Studio, que será lançado ainda neste ano, oferecerá um workspace unificado dentro do Google Ads para ajudar com a revisão, criação de variações infinitas e otimização de assets criativos.
Ainda nessa área, o poder da IA se tornou infinito com o Imagen e Veo: podemos sugerir ideias e assets de forma proativa e criar promoções sazonais com produtos específicos e descontos recomendados.
A IA também atua nos bastidores para melhorar thumbnails, alterar o tamanho de vídeos (usando o “outpainting”) para garantir a melhor performance e oferecer insights detalhados sobre quais elementos criativos (texto, cor, tipo de cena, etc.) têm a melhor performance.


Jennifer Johnson
Senior Manager, Growth Marketing
Jennifer é Senior Manager de Growth Marketing da Ibotta, além de ter experiências anteriores trabalhando para uma agência de marketing digital focada em performance. Na Ibotta, ela desenvolve estratégias digitais de aquisição e retenção de funil completo, com foco em melhorar a eficiência e a escala do app.
Como os apps de eCommerce podem conquistar conversões após a instalação e garantir a retenção de usuários durante Q4, para impulsionar a fidelização e otimizar o LTV?
As instalações conquistadas em dezembro são uma benção e um risco: o tráfego acelera, mas muitos desses usuários somem assim que as festas de final de ano acabam. Para conter essa evasão, incentivamos cada cliente que faz uma compra nesse período a desenvolver um hábito simples e recorrente. Por exemplo, criamos uma narrativa pós-checkout e um fluxo de e-mails que recomenda que os usuários revisem as informações do produto e explorem nossos artigos de bem-estar.
Programamos essas mensagens para momentos de interesse natural, para que elas pareçam úteis, e não insistentes. Dentro do app, atualizamos o feed da página inicial com conteúdos de “bem-estar sazonal”: dicas de snacks para ajudar com a imunidade, estresse ou sono, que levam diretamente para os produtos que eles já compraram. O tom é editorial, não promocional, para evitar que eles deixem de se engajar.
Por fim, quando janeiro chega, mudamos a narrativa: das festas de final de ano para a possibilidade de recomeços com o ano novo, incentivando esses mesmos usuários a definirem novas metas, sem precisar introduzir uma nova curva de aprendizado. Com uma proposta de valor consistente, os cohorts adquiridos nesse período normalmente permanecem ativos.
Observamos uma tendência de foco na aquisição de usuários no início de Q3 e reengajamento em Q4. Como essa mudança afetou o seu planejamento?
Entre julho e setembro, o custo por instalação menor e feeds pouco movimentados nos ajudam a alcançar cohorts por um preço razoável. Nesse período, nossos esforços se voltam para a melhoria do nosso onboarding, quando coletamos sinais que serão úteis mais adiante.
Quando chega outubro, isso muda: focamos em nossas alavancas de retenção e nos preparativos para o próximo pico de compras. Assim, nosso time de CRM troca a narrativa de aquisição para uma jornada de reengajamento: nosso calendário de mensagens push segue o fluxo do Dia dos Solteiros (11/11) e os picos de compras para as festas de final de ano.
Duas semanas após a Black Friday, nossos esforços de mídia paga se voltam para o remarketing; vamos atrás de usuários que já conhecemos, porque a sua intenção de compra é naturalmente mais alta. Como resultado, temos uma curva mais suave, com compras pós-instalação mais baratas logo no começo e um engajamento que gera mais receita mais adiante.
Como usuários que fazem uma compra pela primeira vez podem se transformar em clientes que fazem novas compras dentro de 30 dias?
A contagem regressiva para a fidelidade começa no momento em que a primeira compra é confirmada. Nossa página e e-mail de agradecimento são o primeiro ponto de reconhecimento desse cliente, de um jeito simples e humano, com uma mensagem de “ei, estamos te vendo”.
Dentro de 24 horas, ele recebe um e-mail com dicas de uso e um incentivo para comprar novamente. Sete dias depois, ele somente recebe novas mensagens se abrir o aplicativo depois de receber o pedido; nesse caso, ele recebe uma oferta ou um artigo de bem-estar.
Por volta do vigésimo dia, se ele não fizer nenhuma compra nova, enviamos um incentivo discreto, normalmente na forma de um conteúdo educacional que se correlaciona com o produto original. Pesquisas mostram que o que realmente funciona não é o incentivo em si, mas a sensação de que sabemos o que ele comprou e que temos dicas para que essa compra seja útil.
Essa mistura de reconhecimento, educação e incentivos oportunos ajudam a criar um padrão de compras repetidas.
Segundo nossos dados, usuários de iOS costumam se converter mais rápido e fazer mais compras repetidas. Considerando isso, você adotou fluxos ou mensagens específicas para cada plataforma?
Temos uma única base de códigos, então a paridade de recursos é inegociável. Ainda assim, alguns sinais sutis ajudam a ajustar a experiência.
No iOS, priorizamos a conveniência, com recursos como Apple Pay, adicionar à carteira, e checkout em poucos cliques.
No Android, oferecemos um onboarding com menos etapas. Tirando essas variações, ambas as plataformas têm os mesmos recursos — fidelidade, QR codes, pesquisa fácil, jornadas de compras agilizadas — para que nenhum dos nossos clientes sinta que tem uma experiência pior. A questão é respeitar as normas de navegação de cada plataforma.
Como os fluxos de web-to-app e mídias próprias impulsionam instalações e reengajamentos? Como isso afeta a experiência com o produto?
Nossa principal ponte entre a web e o app é um smart banner que mostramos em páginas acessadas por usuários que apresentam alta intenção. Nele, temos um gancho que destaca uma oferta exclusiva no app: um desconto de 20%. O usuário clica uma vez e já é levado para o app.
Tentamos reduzir ao máximo a fricção da jornada, permitindo que os usuários façam a autenticação mais tarde se eles quiserem só explorar os produtos. Como o banner já traz uma vantagem imediata, olhamos para a conversão como um upgrade, pois uma alta taxa de visitantes do site se tornam clientes regulares do app.


Eugene Kuznetsov
Product Lead
Eugene é um Product Lead obcecado pelo cliente, tendo sido responsável por criar produtos para milhões de usuários na Apple, Bumble e Lazada. Atualmente, na Holland & Barrett, Eugene ajuda a empresa com a sua missão de se tornar uma verdadeira parceira de wellness para 100 milhões de usuários.
Como os apps de eCommerce podem conquistar conversões após a instalação e garantir a retenção de usuários durante Q4, para impulsionar a fidelização e otimizar o LTV?
As instalações conquistadas em dezembro são uma benção e um risco: o tráfego acelera, mas muitos desses usuários somem assim que as festas de final de ano acabam. Para conter essa evasão, incentivamos cada cliente que faz uma compra nesse período a desenvolver um hábito simples e recorrente. Por exemplo, criamos uma narrativa pós-checkout e um fluxo de e-mails que recomenda que os usuários revisem as informações do produto e explorem nossos artigos de bem-estar.
Programamos essas mensagens para momentos de interesse natural, para que elas pareçam úteis, e não insistentes. Dentro do app, atualizamos o feed da página inicial com conteúdos de “bem-estar sazonal”: dicas de snacks para ajudar com a imunidade, estresse ou sono, que levam diretamente para os produtos que eles já compraram. O tom é editorial, não promocional, para evitar que eles deixem de se engajar.
Por fim, quando janeiro chega, mudamos a narrativa: das festas de final de ano para a possibilidade de recomeços com o ano novo, incentivando esses mesmos usuários a definirem novas metas, sem precisar introduzir uma nova curva de aprendizado. Com uma proposta de valor consistente, os cohorts adquiridos nesse período normalmente permanecem ativos.
Observamos uma tendência de foco na aquisição de usuários no início de Q3 e reengajamento em Q4. Como essa mudança afetou o seu planejamento?
Entre julho e setembro, o custo por instalação menor e feeds pouco movimentados nos ajudam a alcançar cohorts por um preço razoável. Nesse período, nossos esforços se voltam para a melhoria do nosso onboarding, quando coletamos sinais que serão úteis mais adiante.
Quando chega outubro, isso muda: focamos em nossas alavancas de retenção e nos preparativos para o próximo pico de compras. Assim, nosso time de CRM troca a narrativa de aquisição para uma jornada de reengajamento: nosso calendário de mensagens push segue o fluxo do Dia dos Solteiros (11/11) e os picos de compras para as festas de final de ano.
Duas semanas após a Black Friday, nossos esforços de mídia paga se voltam para o remarketing; vamos atrás de usuários que já conhecemos, porque a sua intenção de compra é naturalmente mais alta. Como resultado, temos uma curva mais suave, com compras pós-instalação mais baratas logo no começo e um engajamento que gera mais receita mais adiante.
Como usuários que fazem uma compra pela primeira vez podem se transformar em clientes que fazem novas compras dentro de 30 dias?
A contagem regressiva para a fidelidade começa no momento em que a primeira compra é confirmada. Nossa página e e-mail de agradecimento são o primeiro ponto de reconhecimento desse cliente, de um jeito simples e humano, com uma mensagem de “ei, estamos te vendo”.
Dentro de 24 horas, ele recebe um e-mail com dicas de uso e um incentivo para comprar novamente. Sete dias depois, ele somente recebe novas mensagens se abrir o aplicativo depois de receber o pedido; nesse caso, ele recebe uma oferta ou um artigo de bem-estar.
Por volta do vigésimo dia, se ele não fizer nenhuma compra nova, enviamos um incentivo discreto, normalmente na forma de um conteúdo educacional que se correlaciona com o produto original. Pesquisas mostram que o que realmente funciona não é o incentivo em si, mas a sensação de que sabemos o que ele comprou e que temos dicas para que essa compra seja útil.
Essa mistura de reconhecimento, educação e incentivos oportunos ajudam a criar um padrão de compras repetidas.
Segundo nossos dados, usuários de iOS costumam se converter mais rápido e fazer mais compras repetidas. Considerando isso, você adotou fluxos ou mensagens específicas para cada plataforma?
Temos uma única base de códigos, então a paridade de recursos é inegociável. Ainda assim, alguns sinais sutis ajudam a ajustar a experiência.
No iOS, priorizamos a conveniência, com recursos como Apple Pay, adicionar à carteira, e checkout em poucos cliques.
No Android, oferecemos um onboarding com menos etapas. Tirando essas variações, ambas as plataformas têm os mesmos recursos — fidelidade, QR codes, pesquisa fácil, jornadas de compras agilizadas — para que nenhum dos nossos clientes sinta que tem uma experiência pior. A questão é respeitar as normas de navegação de cada plataforma.
Como os fluxos de web-to-app e mídias próprias impulsionam instalações e reengajamentos? Como isso afeta a experiência com o produto?
Nossa principal ponte entre a web e o app é um smart banner que mostramos em páginas acessadas por usuários que apresentam alta intenção. Nele, temos um gancho que destaca uma oferta exclusiva no app: um desconto de 20%. O usuário clica uma vez e já é levado para o app.
Tentamos reduzir ao máximo a fricção da jornada, permitindo que os usuários façam a autenticação mais tarde se eles quiserem só explorar os produtos. Como o banner já traz uma vantagem imediata, olhamos para a conversão como um upgrade, pois uma alta taxa de visitantes do site se tornam clientes regulares do app.
Tentamos reduzir ao máximo a fricção da jornada, permitindo que os usuários façam a autenticação mais tarde se eles quiserem só explorar os produtos. Como o banner já traz uma vantagem imediata, olhamos para a conversão como um upgrade, pois uma alta taxa de visitantes do site se tornam clientes regulares do app.
Quais sinais na primeira sessão ou primeira semana de uso indicam que o usuário é de alto valor, e qual é a sua estratégia quando você os identifica?
Vemos três sinais simples: uma conta com um login do clube fidelidade, uma exploração cuidadosa dos produtos e um comportamento de compras omnichannel.
Quando um usuário mostra esses três sinais, nossos esforços de personalização aumentam: ele recebe carrosséis de produtos específicos, a jornada para uma nova compra começa mais cedo e descontos mais personalizados são oferecidos. É sutil, mas a curiosidade se torna um hábito.
Quando um usuário mostra esses três sinais, nossos esforços de personalização aumentam: ele recebe carrosséis de produtos específicos, a jornada para uma nova compra começa mais cedo e descontos mais personalizados são oferecidos. É sutil, mas a curiosidade se torna um hábito.
Como você está usando a IA em seu produto ou estratégia de retenção?
A IA opera nos bastidores. Ela organiza as grades de pesquisa e categorias em um instante, garantindo que os clientes vejam SKUs relevantes sem precisar ajustar manualmente seus filtros.
Uma ferramenta mais leve de IA generativa ajuda a manter a seção de perguntas e respostas sempre atualizada para que os clientes possam tirar suas dúvidas rapidamente.
Modelos preditivos também avaliam a probabilidade de churn todas as noites; qualquer usuário que apresente esse risco recebe um incentivo. Pode ser um lembrete com dicas de bem-estar ou um pequeno presente por sua fidelidade. Isso acontece antes mesmo que ele pense em desinstalar o app. Nossa tecnologia é transparente com nossos usuários, para que eles encarem o app como algo realmente útil.
Qual é o mix ideal entre os esforços de aquisição de usuários e de remarketing durante o pico de compras?
O orçamento está sempre oscilando. Seis semanas antes da Black Friday, metade dele é destinado para a aquisição, com foco em pesquisas de alta intenção, saltos em ASO e testes de smart banners.
Depois de duas semanas, reduzimos esse investimento e focamos mais em remarketing (com notificações push, campanhas sociais pagas para aumentar o reengajamento, mais pontos de fidelidade, etc.), pois a probabilidade de uma conversão por clique é maior, mesmo com o aumento no custo por instalação.
Dois momentos têm mais peso: os picos de novembro-dezembro (presentes de final de ano) e a primeira semana de janeiro (quando as resoluções de ano novo começam). Esse mix ajuda a manter o custo por aquisição médio mais estável, além de otimizar o lifetime value de cohorts adquiridos durante as festas.
Com a ascensão global dos apps chineses no iOS, como a pressão do mercado afeta a sua estratégia?
O aumento no custo por instalação no iOS nos forçou a ser mais disciplinados. Cada campanha paga passa por um teste simples: o cohort vai equilibrar as contas em 90 dias? Se a previsão for negativa, cortamos esse gasto automaticamente.
Em paralelo, investimos mais em ciclos de baixo custo (SEO, otimização de smart banners, programas de referral, QR codes para cadastros), para que uma boa parte do crescimento aconteça sem precisarmos lutar por bids.
Os ciclos de atualização em nossos criativos duram duas semanas para combater a fadiga de anúncios sem aumentar os bids. Na prática, ainda escalamos novos usuários todos os trimestres, mas o equilíbrio entre esforços pagos e mídias próprias se mantém estável, o que ajuda a nos proteger de saltos repentinos nos custos.
Principais conclusões


