
iOS paid installs up at least 25% in Western markets while Android shows flat or negative growth
Cross-platform journeys: Mobile holds 60-80% of user activity
A Market in Motion
Global app marketing spend reached $109 billion in 2025, with both user acquisition ($78B) and remarketing ($31B) posting strong growth, but the story behind that number reveals a market undergoing significant restructuring.
The mobile landscape shifted along multiple axes, with iOS and Android diverging, Western and non-Western markets following opposite trajectories, user behavior moving toward cross-platform patterns, and AI adoption expanding beyond technical tasks into campaign optimization.
This year saw iOS spend surge while Android remained flat, non-gaming rose 18% while gaming grew just 3%, driven by major gains in eCommerce and Finance verticals, and Europe posted a substantial lift as Android-heavy regions lost share despite absolute growth.
AI’s influence manifested across multiple dimensions. Generative AI apps reached $824 million in spend, growing roughly 50% year-over-year and becoming the fastest-growing category on Android and 4th on iOS. On the marketing side, AI agents moved from technical support into active campaign management. The shift from “trust but verify” to “verify then automate” is underway, with marketers increasingly comfortable allowing AI to manage campaigns with less manual supervision.
At the same time, remarketing’s share of total spend rose from 25% to 29%, as brands recognized that reactivating existing users delivers better unit economics than competing for new ones in a crowded market.
User behavior also evolved in ways that challenge traditional measurement. Cross-platform engagement became more common, with mobile consistently holding the majority of activity even as users alternated to CTV, PC, and console.
These changes represent connected forces that are reshaping mobile marketing, with implications that will define strategy, measurement, and budget allocation throughout 2026.
All results are based on fully anonymous and aggregated data. To ensure statistical validity, we follow strict volume thresholds and methodologies and only present data when these conditions are met.
Non-gaming UA investment in iOS propels 13% rise to $78B
Global app marketing spend on user acquisition reached $78 billion in 2025, up 13% YoY, driven entirely by iOS, which surged 35% while Android remained flat (-1%). Non-gaming led the expansion, rising 18% YoY to $53 billion, while gaming investments grew 3% to $25 billion.
Non-gaming’s rise was powered by a 40% jump in iOS spend, led by Shopping, which grew 70% overall and 123% on iOS, largely due to major budgets from China based eCommerce apps. Casinos and gambling also grew sharply at 127% YoY. Gaming saw steadier gains (6% iOS, 2% Android), showing continued investment despite non gaming’s dominance.
At the market level, Europe emerged as the biggest winner, with strong YoY growth, again influenced by China based eCommerce spend. Spain rose 127% with roughly 50% share uplift, Italy grew 70%, the UK enjoyed a 35% share jump, while Germany and France rose 43% and 52%, with 30% and 23% share gains. The US, despite already commanding 42% of global spend, still grew strongly on iOS (+25%).
In contrast, several Android heavy markets lost ground: Brazil dropped 43% in share, and India rose only 6% YoY while losing 28%. Mexico saw a similar 28% share decline. Other markets such as Australia (21%) and Turkey (59%) saw growth, while Vietnam fell 46%.
Generative AI apps also continued expanding, reaching $516 million on iOS and $308 million on Android, growing 47% and 53% YoY. GenAI was the fastest growing category on Android and #4 on iOS, driven by rising demand for creative, productivity, and AI companion experiences, signaling its shift from niche to a mainstream spending category across both platforms.
2026 outlook: Despite the mobile market experiencing slowing user growth, we expect global UA spend to rise in 2026. This increase will be driven by a fundamental scarcity of attention: Generative AI and low-code tools have lowered the barriers to entry for both ad creation and development, flooding the market with more products and infinite creative variations, shifting the bottleneck from creation to consumption. The result: fierce competition for the same eyeballs, and ultimately media cost inflation as brands bid aggressively to cut through the noise.
This scarcity is forcing a massive structural pivot in where budgets flow. eMarketer and Magna (IPG) forecast that mobile video ad spending will surpass search spend for the first time in 2026 as advertisers are reallocating budgets toward high-impact short-form video (UGC on ad networks, TikTok, Reels, YouTube Shorts). In 2026, efficiency will come from the “share of attention” commanded by video creatives, making it the primary growth lane in a maturing digital market.
App install (UA) ad spend by country & platform (2025) *
Year-over-year % change in app install ad spend (2025 vs. 2024)
Remarketing spend jumps to $31B as its share of spend rises to 29%
Global remarketing spend reached $31.3 billion in 2025, increasing 37% YoY as more budgets shifted toward reengaging existing users. iOS accounted for $17 billion, rising 71% YoY, while Android reached $14 billion, up 10% YoY, meaning most growth came from iOS. As a result, remarketing’s share of overall app marketing spend (UA plus remarketing) rose from 25% in 2024 to 29% in 2025, showing that reengagement is becoming a larger part of the performance mix.
The value of remarketing is clearly rising as reengagement increases LTV through repeated purchases, subscription retention, and renewed session activity. It is also an efficient way to reactivate dormant users, especially in categories with fast early churn.
This year’s iOS growth reflects broad geographic expansion. Android-driven markets saw sharp increases in iOS remarketing, especially across Central Europe, Latin America, and Southeast Asia, where multiple countries posted 100%+ YoY growth. Western markets also expanded, generally in the 50% to 85% YoY range. Saudi Arabia (-11%) was the only market to contract, making the trend broadly consistent.
Category trends on iOS show remarketing gaining traction across utility based and commerce driven verticals. Transportation leaped 362% YoY, Travel 145%, and Finance 135%, showing greater emphasis on users who transact frequently or rely on recurring services. Shopping, already the largest category by far, still rose 66% YoY, reinforcing its central role.
Android’s YoY picture was more mixed. Growth concentrated in a handful of emerging markets, rising 30% to 130% YoY, while several mature markets declined, including the US (30% down) and parts of Western Europe. Category expansion was steadier, led by Finance (71%), Utility and Productivity (47%), and Transportation (28%), while Gaming (5%) and Shopping (1% down) remained flat.
2026 outlook: As the mobile market matures and UA costs rise due to the saturation described above, 2026 is expected to accelerate the shift toward a “Retention First” economy. With Gartner (2025) reporting that 80% of future revenue for mobile businesses will come from just 20% of existing customers, the strategic imperative will lead to greater focus on maximizing LTV of existing users.
As a result, remarketing investment is also expected to increase in 2026. In a stabilizing economic environment where “growth at all costs” is replaced by profitability, reactivating a dormant user will be viewed as more capital-efficient than battling for a new one in a crowded space.
App remarketing ad spend by country
& platform (2025) *
Year-over-year % change in remarketing spend (2025 vs. 2024)
Technical AI agents at 57% usage, but optimization agents already at 32%
The deployment data shows that while marketers are sophisticated, most use AI primarily as a defensive layer. The fact that 57% of active agents are focused on technical “sure bets” like detecting configuration issues aligns perfectly with the chat logs, where most interactions are support queries regarding integration and setup.
This shows that most users have hired the AI as a technical engineer to ensure the data pipes are connected and the numbers are trusted before they venture any further. Yet the 32% adoption of Business Optimization agents proves the intent to scale from sophisticated marketers is there.
The AI Assistant reveals even deeper sophistication. Based on an analysis of over 10k questions, 60% queried complex analytical questions. Among these “Power User” questions, 38% focused on Efficiency and Spend (ROAS, CPI) compared to just 22% for Volume. They are actively optimizing their portfolios using the Copilot to “trust but verify” the unit economics before making a move. This explains the adoption gap: they are comfortable automating the technical health (Agents), but for the core performance strategy (Budget & ROAS), they prefer the active supervision of the Chat.
The AI Assistant data also reveals two distinct personas: Gaming marketers, often a savvier audience, act as “Profit Maximizers,” with 57% of their chat queries focused on policing margins (Efficiency), while Retail and Fintech marketers act as “Growth Hunters,” prioritizing Volume & Traffic (~37%) to capture market share.
2026 outlook: With AI moving faster than the speed of light, predictions can be tricky. Nonetheless, we believe that in 2026 we’ll see a significant shift from “Defensive” to “Offensive” AI. The current “Trust but Verify” phase where users manually audit AI insights is set to evolve into “Verify then Automate,” as validated checks mature into autonomous agents. As a result, the marketer’s role is expected to transition to a strategic orchestrator setting guardrails, allowing AI to address wasting campaigns with greater speed.
Usage of AI agents (%) *
iOS paid installs up at least 25% in Western markets while Android shows flat or negative growth
Paid install changes across iOS show strong year-over-year gains in both Western and non-Western markets. Western markets rise 25% to 84% in overall paid installs, with Shopping and Finance between 48% and 200%. Non-Western markets show even larger lifts at 84% to 189%, with several Shopping markets above 100% YoY and Finance reaching 253% in some regions.
Android displays a more uneven pattern. Western markets show low or negative movement: the US (+8%), UK (+1%), Germany (-1%), Italy (-2%), and Australia (-9%). Major non-Western markets deliver nearly all Android gains at 10% to 55%, with Shopping and Gaming showing -32% to +71% ranges and more negatives than iOS. The result is a clear split: Android growth concentrates almost entirely in non-Western markets, while Western Android performance stays flat or declines.
Remarketing conversions follow a similar structure. On iOS, Western markets generally grow 34% to 94% YoY, with the US (+49%), Germany (+94%), UK (+52%), France (+34%), and Canada (+46%) as examples. The steepest rises appear in major non-Western markets such as Mexico (+426%), Brazil (+157%), India (+118%), and Indonesia (+102%), with several countries posting triple-digit gains. Despite these impressive increases, iOS remarketing in non-Western markets still represents a very small audience, although typically high-value users.
Android remarketing conversions remain mixed in Western markets: from -7% in the US to modest positives like UK (+9%) and Germany (+10%), while almost all sustained growth comes from non-Western countries including Mexico (+177%), Saudi Arabia (+85%), Nigeria (+210%), and Thailand (+51%).
2026 outlook: eMarketer forecasts emerging markets will lead digital ad growth with double-digit gains. The “Next Billion Users” will be acquired mainly on Android in non-Western regions, while Western spend pivots toward retention and remarketing on iOS.
Year-over-year % change in paid installs (2025 vs. 2024)
Year-over-year % change in remarketing conversions (2025 vs. 2024)
Cross-platform journeys: Mobile holds 60-80% of user activity
With channel and platform hopping now the norm in consumer behavior, our preliminary cross-platform data reveals the primary journeys of cross-platform users across gaming (PC and console) and non-gaming (mobile and CTV) verticals.
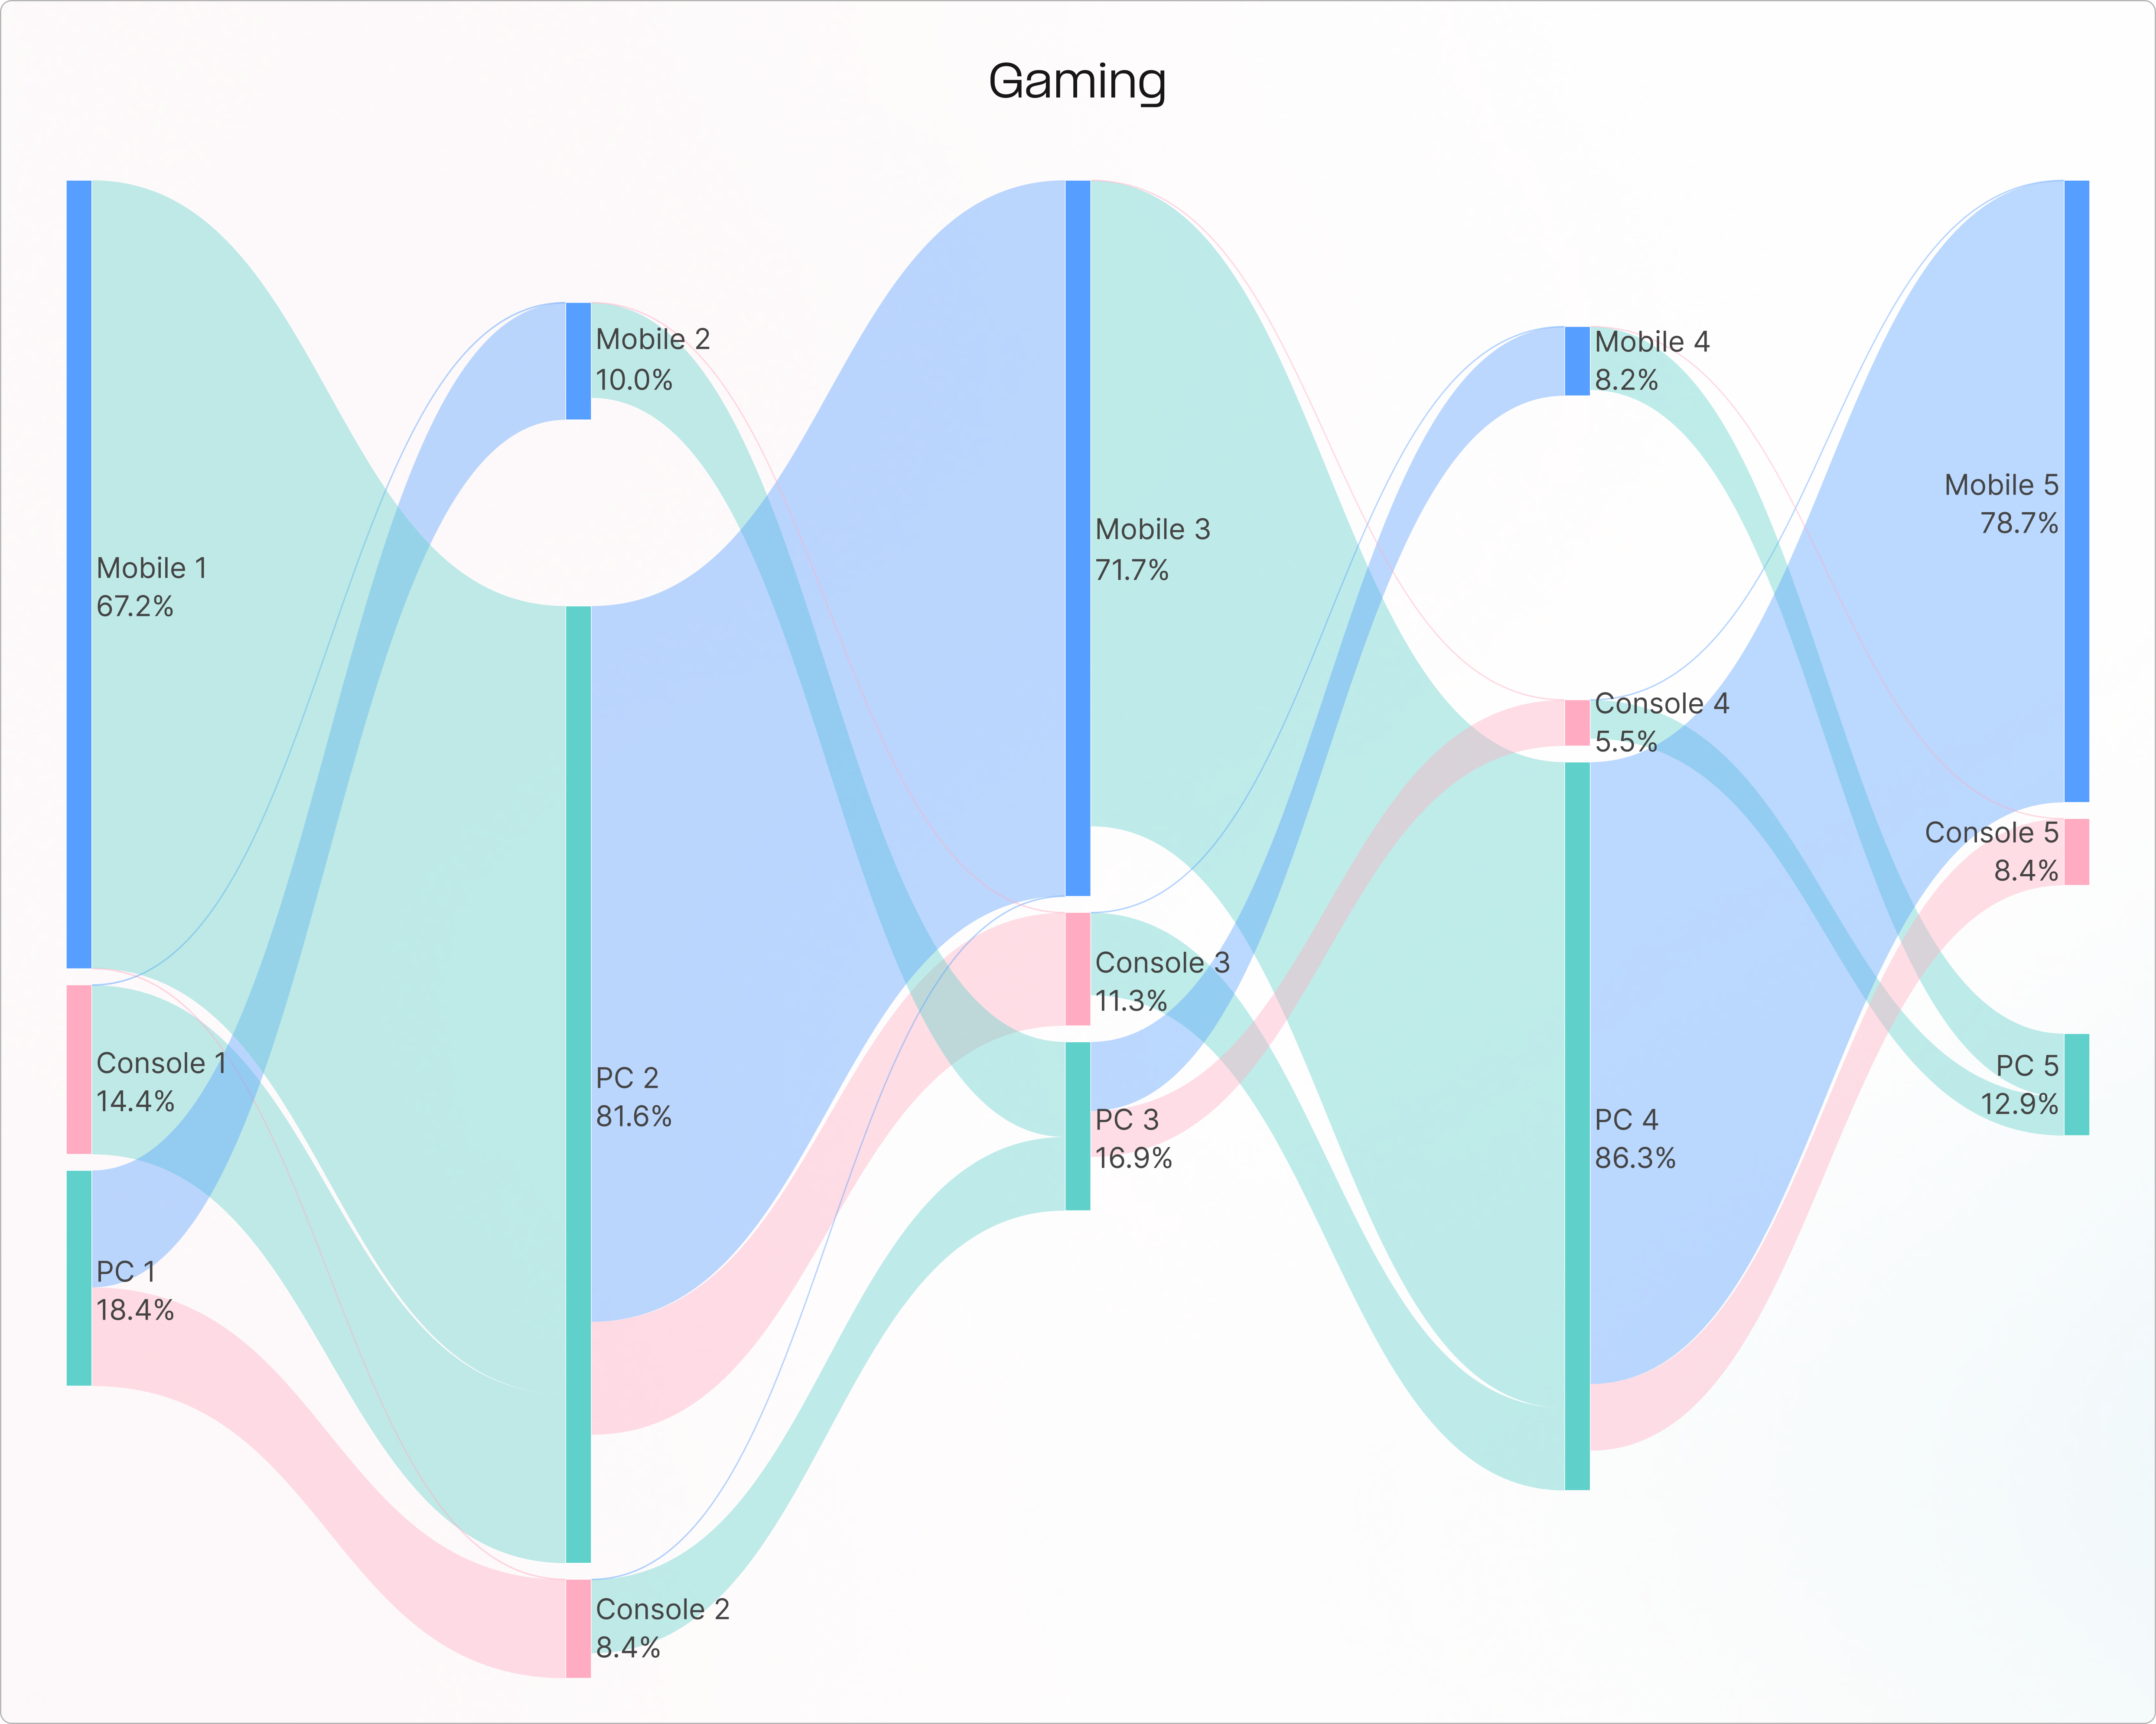
Gaming
Primary journey: The data shows a dominant mobile-PC loop. This pattern captures the majority of users, beginning with 67% moving from mobile (Step 1) to PC (Step 2). Retention within this circuit is high, with users alternating between platforms without deviation. This loop accounts for 79% of all final-stage activity. Mobile serves as the persistent endpoint, while PC functions as the mandatory bridge for every even-numbered step.
Secondary journey: The console-PC loop follows an identical pattern but substitutes console for mobile. This path starts with just 14% of traffic and shrinks to 8% by the final step. While structurally similar to the primary flow, this loop is significantly smaller and “leakier,” confirming mobile as the true destination.
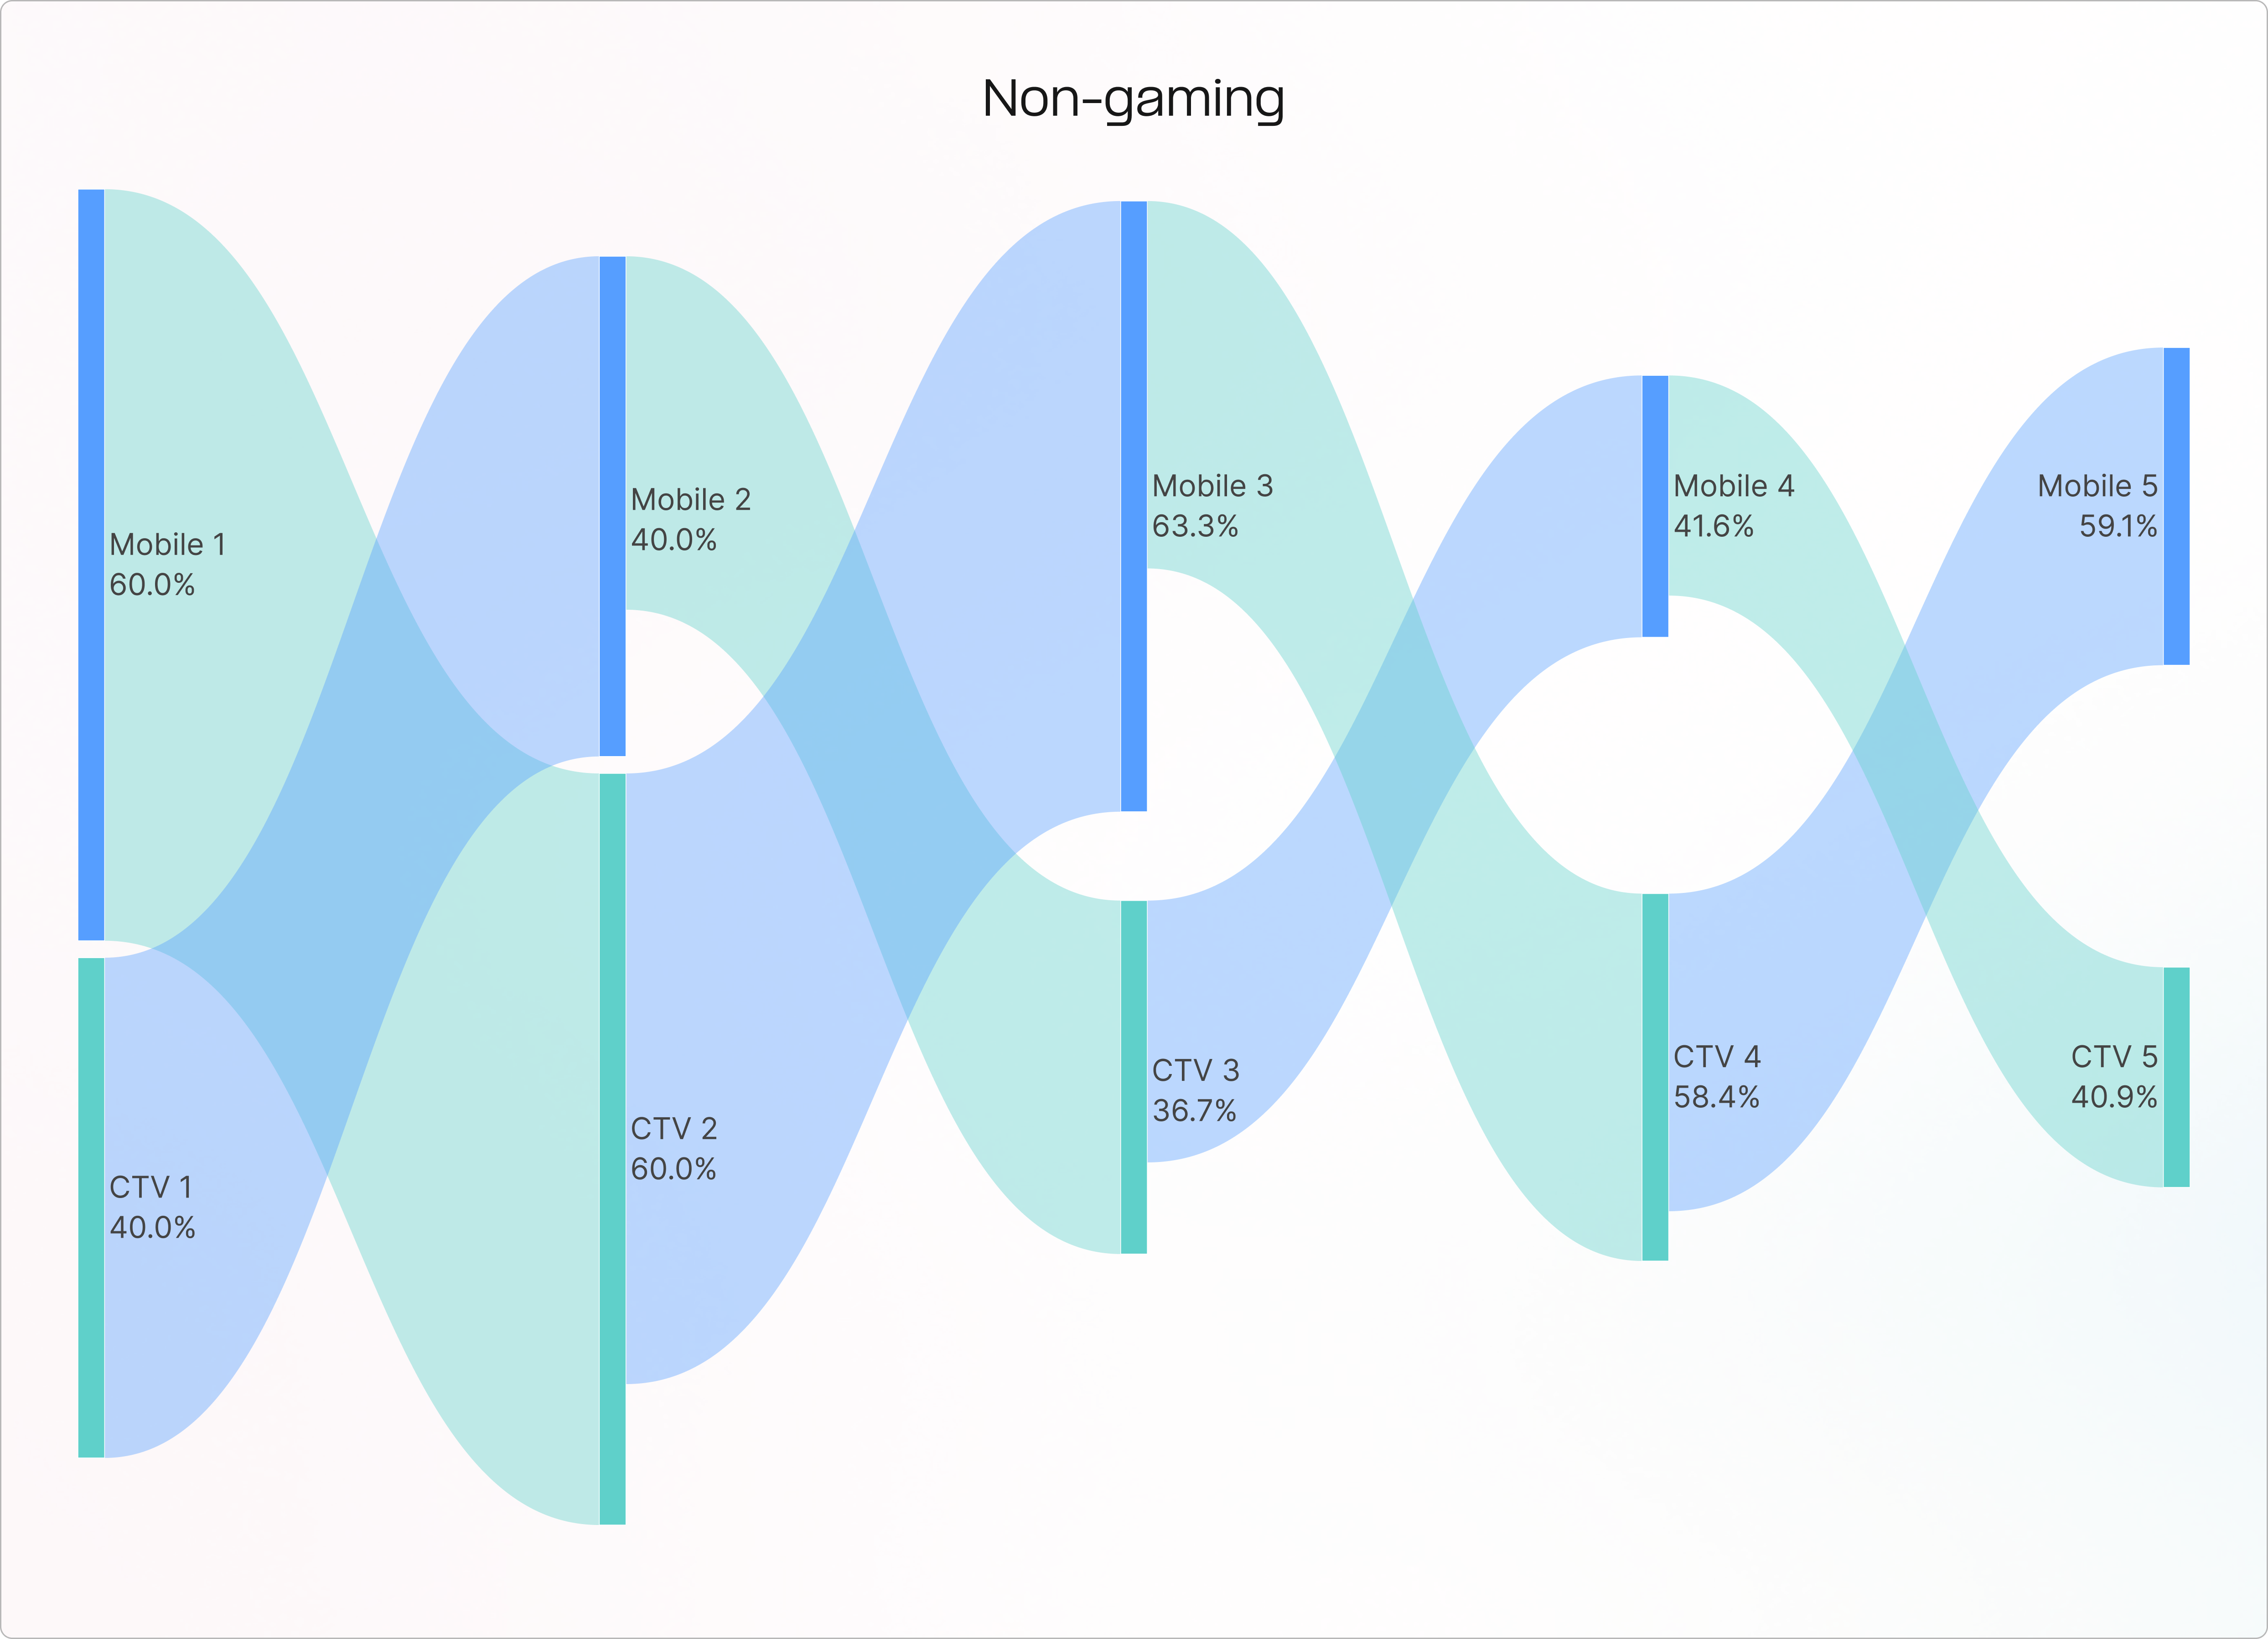
Non-gaming
Primary pattern—the mobile-initiated wave: The dominant journey begins on mobile, commanding 60.3% market share at Step 1. Nearly 57% of total volume flows from mobile to CTV in Step 2, making CTV the dominant device for the second stage. Volume surges back to mobile in Step 3 (63.6%), swings to CTV in Step 4 (54.8%), and settles on mobile for Step 5 (60.2%). This “M-shaped” flow represents majority behavior, with users consistently alternating devices at every stage.
Secondary pattern—the CTV counter-flow: This journey mirrors the primary pattern but starts from CTV (38.2% of initial volume). Users switch to mobile in Step 2, continue their “W-shaped” journey to CTV in Step 3, return to mobile in Step 4, and end on CTV in Step 5. While significant, this flow is smaller than the mobile-initiated wave.
From looking at the gaming and non-gaming data, it appears that mobile is not just a participant; it is the persistent “home base” that orchestrates the entire user journey, requiring engagement strategies that treat the smartphone as the primary controller of the experience across all verticals.
2026 outlook: The data shows omni-channel engagement is becoming the default behavior, with users seamlessly moving between mobile, CTV, PC, and console. Success will depend on understanding these cross-device loops rather than evaluating each platform in isolation, as user decisions increasingly span multiple touchpoints within a single journey.
About the authors


