+17% Increase in ‘IAS Only’ share from 53% to 62% among OTT & Live Streaming apps to lead the shift toward pure subscription.
10:1 The ratio of retrieval to diagnostic queries among subscription marketers using AI chat tools
19% Free trial-to-paid conversion rate in Gaming: the lowest in the dataset despite the highest trial adoption
AI and Android growth are reshaping the subscriptions economy
The subscription app market is growing, but not necessarily in the ways or places most marketers expected.
Two shifts stand out, converging to reshape what subscription app marketing looks like in 2026. The first is AI, but not as a feature, as infrastructure. Bidding algorithms now optimize across thousands of variables in real time. Creative generation is compressing campaign cycles from weeks to hours. Predictive models are changing which users get targeted and at what price. The competitive advantage is shifting from budget size to data quality and the speed to act on it.
The second is a geographic and platform reorientation that is quietly redrawing the map. User acquisition spend and paid installs are rising. But iOS organic installs are declining, and North America appears to be maturing across multiple categories. A growing share of subscribers is now coming from India, LATAM, the Middle East, and Southeast Asia, leading Android to cross the paid majority threshold of its own installs for the first time.
For marketers whose playbooks were built around iOS-first, North America-first acquisition, this may represent a meaningful reorientation. The economics differ: CPI, monetization dynamics, and platform mechanics all point to a different kind of growth.
The category picture adds another layer of complexity. Short Drama and OTT & Live Streaming are in aggressive global expansion mode. Ad spend from games that offer subscriptions is declining on both platforms. Health & Fitness is consolidating around a smaller group of well-capitalized iOS apps, while Generative AI is renegotiating its monetization model mid-flight.
This report maps where subscription app marketing stands today: where growth is coming from, which categories are pulling ahead, how monetization models are shifting, and how marketers are, and aren’t yet, using AI to make sense of it all.
* All results are based on fully anonymous and aggregated data. To ensure statistical validity, we follow strict volume thresholds and methodologies and only present data when these conditions are met. ** OTT & Live Streaming, Short Drama, Health & Fitness, Education, Utility & Productivity, Gaming, Dating, Business, Photo & Video, Lifestyle, Generative AI, Books & Reference, Graphic & Design.
UA ad spend rises 24% YoY with Streaming, Short Drama surging
Total user acquisition (UA) ad spend among subscription apps grew +24% year-over-year (Oct 25-Feb 26 and Oct 24-Feb 25) with Android driving the rise with +42% vs. iOS at +10%.
OTT & Live Streaming is the standout on both platforms: Android +240%, iOS +120% with North America Android surging 157%. Short Drama Android grew 42% overall, but the geo reallocation is the real story: North America (-40%) and SEA (-39%) fell sharply while the Indian Subcontinent surged +423% and LATAM grew +77%. Marketers are rotating budget toward markets where install efficiency is still high.
Education Android +114% is dominated by the Indian Subcontinent, jumping 184%, while Health & Fitness shows the sharpest platform divergence: iOS up 87%, Android down -41%. The Android decline is broad-based across every geo, while iOS spend is concentrating where subscription LTV justifies the higher CPI.
Gaming is cutting everywhere: Android -14%, iOS -32%. North America Android saw a -21% drop, whereas Eastern Europe was the one exception at 20% growth. Utility & Productivity splits cleanly by platform: Android rising 93% while iOS falling -23%. On Android, Indian Subcontinent and Middle East are driving the increase; iOS pullback is concentrated in North America and Western Europe.
The overarching signal: spend is rotating toward Android in volume-driven categories (Short Drama, Education, OTT, Utility & Productivity) and toward iOS where conversion quality matters more (Health & Fitness, Dating). Gaming is being defunded on both platforms.
When it comes to the ad spend split by category, we can also see that iOS concentrates in monetization-quality categories: Health & Fitness (23%), Dating (14%), Utility & Productivity (17%), and Business (9%) together account for 63% of all iOS UA spend. The equivalent categories on Android total just 14%.
Android in turn dominates volume categories: Gaming (25%), Education (21%), and Short Drama (19%) account for 65% of Android spend, versus only 13% on iOS. OTT is the one category where both platforms are betting equally (11% share on iOS and Android) — the only major category with no platform skew.
Year-over-year % change in user acquisition ad spend for subscription apps *
Ad spend split by category among subscription apps (Oct 25-Feb 26)
Budget concentration: Winners keep winning in fast-growth categories
An analysis of market concentration among the top 5 apps in each category shows that Short Drama and OTT & Live Streaming are structurally concentrated at 90%+ and staying that way in each time frame. The likely cause: both categories are content-driven, where catalog depth and brand recognition create compounding advantages. New entrants can acquire users but can’t easily displace the content libraries of incumbents.
Concentrating further are Health & Fitness, where the top 5 share jumped from 54% to 73%, the largest shift in the dataset. Spend grew 87% on iOS but flowed to a small group. It appears that subscription LTV in this category is high enough that only well-capitalized incumbents can afford the CPIs while smaller apps get priced out of the auction as competition intensifies.
Democratizing trends lead Photo & Video top 5 share to drop from 64% to 45%. The most plausible cause is a wave of AI-powered photo and video tools entering the market with enough differentiation to attract UA budgets, disrupting incumbents rather than fighting for the same positioning.
Gaming, Dating, and Utility & Productivity barely moved despite very different spend trajectories. Gaming is shrinking overall (-14% Android) but no single app is consolidating the cuts. Dating is growing (+86% Android) but gains are spread as the category is inherently geo- and demographic-specific, limiting any single app’s addressable market.
The fastest-growing categories (Short Drama +155%, OTT +170%) also have the highest concentration. One explanation is a flywheel effect where leaders use install volume to train better bidding algorithms, lowering their effective CPI relative to challengers over time.
Concentration of ad spend among top subscription apps by category
Android paid installs up 57% YoY vs. only 9% on iOS
Paid install growth in subscription apps remains strong, but the real story is where it’s coming from. Overall paid installs grew 47% YoY in Oct 2025–Feb 2026 vs. Oct 2024–Feb 2025, and Android is driving the bulk of it.
Android paid installs grew 57% YoY vs. 9% for iOS. The former’s paid share of total installs rose from 43% in the prior period to 51% — paid has crossed the majority threshold. iOS moved from 30% to 34% over the same period. The organic signal makes the gap more meaningful: Android organic was up only 13% while iOS organic declined 8%.
Lower CPIs, broader addressable reach, and improving monetization on Android have made it the growth engine for paid acquisition. iOS remains in the mix but with single-digit YoY growth.
Two categories accounted for the bulk of Android’s net paid install gain. Short Drama drove 60% of the total delta (+155% YoY). OTT & Live Streaming contributed 13% (+170%). Education added 22% of the delta (+66%), concentrated almost entirely in the Indian Subcontinent.
Geographically, Indian Subcontinent alone accounted for 49% of the net Android delta (+95%), followed by LATAM (+52%, 18%) and SEA (+36%, 11%). Eastern Europe (+95%) and Middle East (+197%) contributed a combined 18%. North America was essentially flat.
A look at the share of paid installs, we can see that Short Drama and OTT & Live Streaming are both moving toward more paid, but from different starting points. Short Drama Android was already predominantly paid (77%) and edged up to 81% in Oct 2025–Feb 2026 vs. Oct 2024–Feb 2025. OTT made a bigger jump: Android +56% (25% to 39%), iOS +34% (35% to 47%), with Eastern Europe Android (+131%) and Middle East iOS (+200%) leading. Japan & Korea and SEA moved the other way as organic carries growth without UA support.
Utility & Productivity and Generative AI point in opposite directions. Utility & Productivity iOS is getting more paid-dependent: North America crossed 50% (+55%, 33% to 51%), while Android’s flat global average masks a sharp organic takeover in Japan & Korea (-51%, 81% to 40%). Generative AI fell on both platforms (-32% Android, -45% iOS), with Indian Subcontinent Android (-81%) seeing the steepest drops. LATAM iOS is the exception at +156% (18% to 46%), still in active acquisition mode.
Year-over-year % change in paid installs for subscription apps *
Share of paid installs trend by region and category
OTT doubles down on pure subscription, Short Drama and Gaming diversify
Across subscription app categories, monetization models are moving in different directions and the divergence is more complex than a simple shift toward or away from pure subscription.
OTT & Live Streaming is the clearest consolidation story. IAS Only share rose from 53% to 62% (+17%) while IAS & IAP fell from 47% to 38%. The direction is consistent month over month with no reversal. This aligns with the category’s aggressive UA investment (+240% Android, +120% iOS): when the monetization model is clean and predictable, marketers are more willing to spend heavily on acquisition.
Short Drama is moving in the opposite direction, and the shift is notable. IAS & IAA went from near zero (0.9%) to 7.4% in Period B, while IAS Only fell from 46% to 42%. Apps in this category are layering in ad-supported models, likely a response to the economics of emerging markets where subscription conversion rates are low relative to install volume. The category is scaling fast on installs but appears to be testing whether subscriptions alone can convert that volume into revenue.
Gaming shows the most complex model evolution. IAS Only rose modestly (45% → 49%), but the more significant move is IAS & IAP growing from 29.5% to 37% (+25%) while IAS & IAA dropped sharply from 12.8% to 7.1% (-44%). Gaming is actively trading ad revenue for in-app purchases, which seems to be a deliberate shift away from ad-dependent models toward higher-value transactions, even as overall UA spend declines.
Generative AI continues adding IAP. IAS Only fell from 65% to 60% while IAS & IAP grew +20%. Apps that launched as pure subscription are hedging with purchases, likely to capture users unwilling to commit to recurring billing, which is consistent with the pattern across multiple prior quarters.
Lifestyle is adding ads, not simplifying. IAS & IAA grew from 5.4% to 9.2% (+70%) while IAS & IAP declined. Dating is slowly consolidating around pure subscription: IAS Only moving from 51% to 56% as IAS & IAP gradually retreats, consistent with the category’s growing paid UA investment.
Share of apps split by business model *
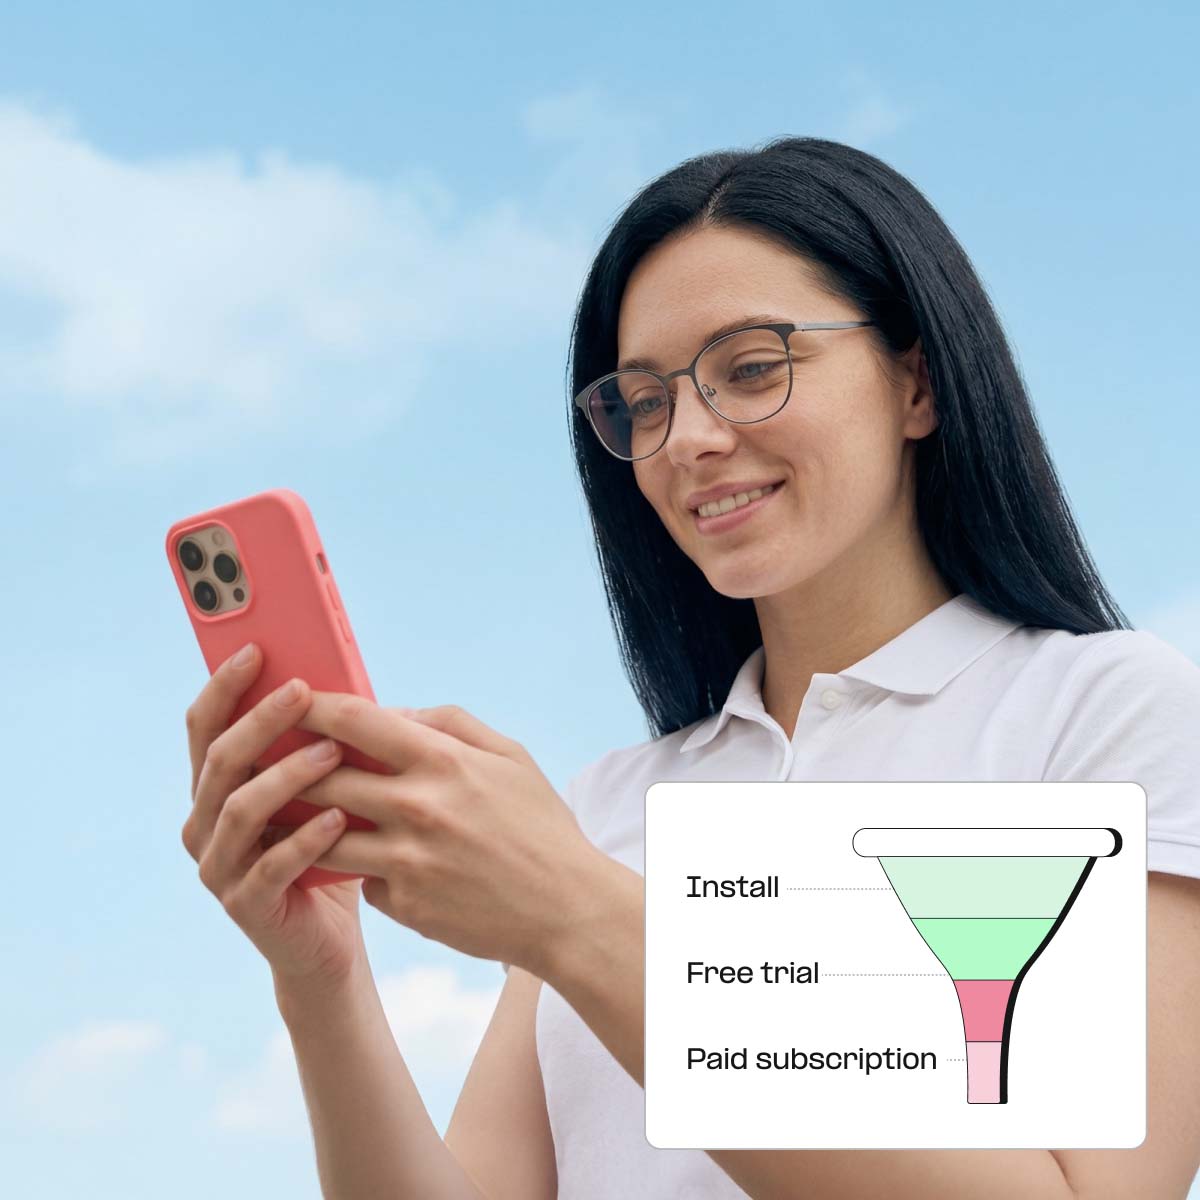
The subscription funnel: Not all trials are created equal
The subscription conversion funnel shows Gaming has the highest free trial adoption but the worst conversion. At 12.2% install-to-trial, Gaming pulls more users into trials than any other category, but only 19% of those convert to paid, the lowest CR in the dataset by far. Every other category converts at 32%+. Gaming’s trial model appears to be a discovery mechanism rather than a purchase intent signal, meaning users try but then churn. High trial volume is masking a monetization problem, not solving it.
Education and Lifestyle punch above their weight on conversion. Education converts 42% of trialists to paid (highest in the dataset) suggesting users who start a trial are highly motivated and the product delivers enough value to justify the subscription. Lifestyle also converts 41% despite the lowest install-to-trial rate (3.9%), meaning it attracts fewer trialists but keeps nearly half of them. Both categories are the opposite of Gaming: lower funnel volume, higher funnel quality.
The no-trial chart reveals a different competitive landscape. Health & Fitness (7.1%) and Dating (6.5%) lead paid subscription conversion without a free trial. These are categories where users arrive with high purchase intent and don’t need a trial to decide.
Short Drama and Utility & Productivity sit at the bottom of the no-trial funnel at 1.8% and 1.7% respectively, well below the 3.5% overall average. For Short Drama this is expected as the category is almost entirely UA-driven with strong acquisition scale but weak monetization conversion relative to install volume.
The subscription funnel (Oct 25-Feb 26)
How subscription marketers use AI chat: more to retrieve, less to reason
The pattern across over 4,000 queries tells a story about how subscription marketers relate to their data. Nearly 40% of all queries fall into channel performance and cost topics. This is not because these queries are the most strategically important questions, but because those are the questions the tool makes easy to answer. The AI assistant is being used for the path of least resistance.
The 6% diagnosis rate within the Media Source and Optimization bucket is equally telling. Most users ask “which campaign had the highest ROAS D7” rather than “why did ROAS drop on this campaign last week.” The retrieval-to-diagnosis ratio is roughly 10:1. This likely reflects a prompting ceiling: most users don’t structure a diagnostic question for an AI, so they default to ranking and lookup tasks they know will return a clean answer.
The Business category’s 18% Retention & Cohort share, which is 4x the overall rate, suggests that when the business model demands lifecycle thinking, it surfaces in how marketers prompt. Media & Entertainment’s 27% Chart Summarization share points to a different dynamic: these marketers are using the tool as a passive reader rather than an active analyst, asking the AI to interpret dashboards rather than investigate performance. Both are legitimate use cases, but neither reflects the full potential of AI-assisted decision-making.
Dating leads on Install & Attribution at 19%: nearly 2.5x the overall rate, which is consistent with a high-CPI vertical where every install is scrutinized and attribution accuracy has direct budget implications. When acquisition costs are high, marketers ask sharper questions.
AI Assistant questions split by type among subscription marketers *

The next subscriber is more likely to come from India, LATAM, or the Middle East than from North America. Build Android-first acquisition strategies for emerging markets: different creatives, different price points, different monetization expectations. The playbooks built for Western iOS users won't transfer directly.

Gaming is spending heavily on trials that convert at 19%. Before increasing UA budget, establish whether your trial is generating purchase intent or just free usage. Education and Lifestyle show that lower trial volume with higher conversion is a more efficient path.

Pure subscription is gaining ground in OTT & Live Streaming, but Short Drama is layering in ads and Gaming is trading ad revenue for IAP. Generative AI is adding IAP as a fallback for users unwilling to commit to recurring billing. No single model is winning across the board. Audit your current mix against your category benchmark.

Short Drama and OTT & Live Streaming top 5 apps control 90%+ of spend. Health & Fitness is consolidating fast. In these categories, incremental UA budget without a genuine product or content advantage will not move the needle. Photo & Video shows that AI-powered differentiation can break concentration but it requires a distinct angle.

The data shows subscription marketers using AI assistants almost entirely for retrieval: rankings, lookups, top-line performance. The diagnostic questions like why did ROAS drop, what's driving churn in this geo, and which campaign mix is underperforming are largely going unasked. The tools can answer them.
About the authors