

How banks measure marketing ROI across every channel: Paid, owned, and app


TL;DR
- Banks measure paid acquisition but lack unified attribution for owned channels (email, SMS, push), web, QR codes, and re-engagement campaigns.
- Cross-device journeys (mobile ad to desktop conversion, desktop research to mobile app) remain invisible in single-device attribution, causing channel misattribution
- AppsFlyer’s omnichannel attribution connects all channels (paid, owned, web, re-engagement, and cross-device) to deposits and loans
- Banks implementing complete attribution can discover which channels deliver the best cost efficiency.
- Unified measurement enables data-driven budget allocation across acquisition and retention while maintaining banking-grade compliance (SOC 2, ISO 27001, ISO 27701, GDPR, CCPA)
The attribution gap affecting banking marketing budgets
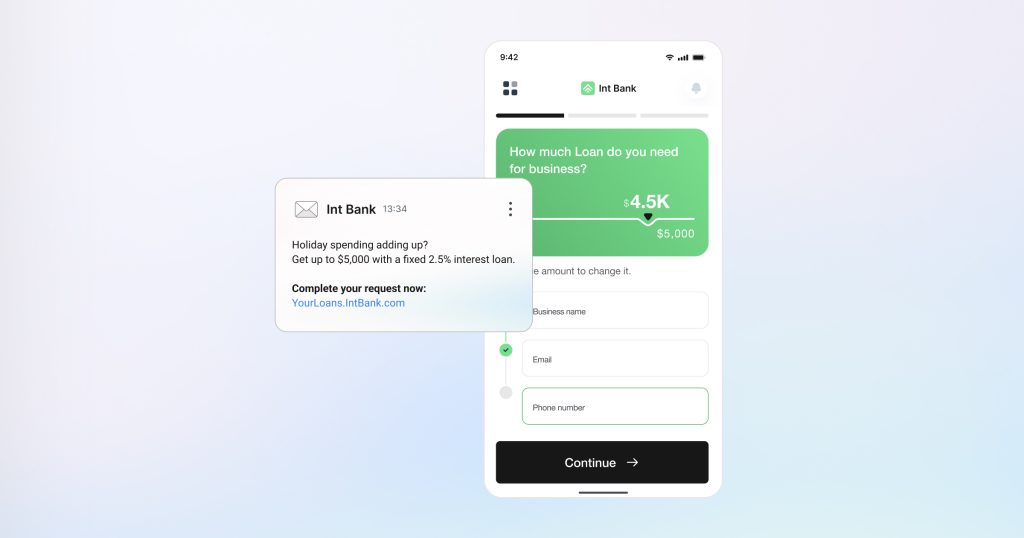
A regional bank runs marketing across every channel: paid acquisition delivers 50,000 app installs at $52 cost per install (CPI), email campaigns reach 2 million customers, SMS sends 150,000 notifications, and re-engagement programs target 200,000 dormant accounts. When leadership asks which channels drove the most deposits, there’s no answer. Paid acquisition measures CPI. Email reports open rates. SMS shows click rates. Re-engagement counts reactivations. None connect to actual deposits, loans, or revenue.
Banks need unified attribution connecting all channels; paid ads, email, SMS, push, web, QR codes, and re-engagement, to banking outcomes: deposits, loan applications, account openings, and revenue. Without this, marketing teams can’t compare channel performance, prove ROI, or optimize budget allocation.
Omnichannel attribution measures every touchpoint (paid, owned, web, and re-engagement) against the same banking outcomes, enabling direct channel comparison and data-driven decisions.
Why traditional attribution creates blind spots
Most banks measure paid acquisition effectively: cost per install, campaign performance, user quality. But the majority of marketing activity; email campaigns, SMS, push notifications, website interactions, re-engagement programs, operates without revenue attribution.
The measurement gap:
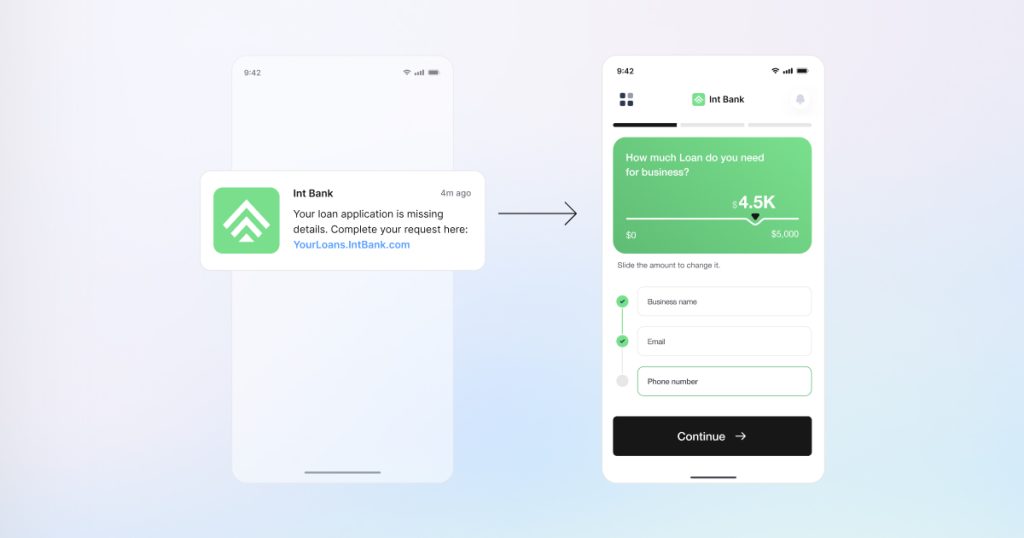
- Email campaigns report open rates and clicks, not deposits or account openings
- SMS measures delivery, not completed transactions or funded accounts
- Push notifications show tap rates, not banking outcomes
- Re-engagement counts reactivations, not incremental lifetime value
- Cross-device journeys remain invisible
The budget allocation problem:
Without unified attribution, budget decisions default to defending existing allocations rather than optimizing for performance. Paid acquisition gets prioritized because it’s measurable. Owned channels get underfunded despite potentially superior efficiency.
The performance opportunity:
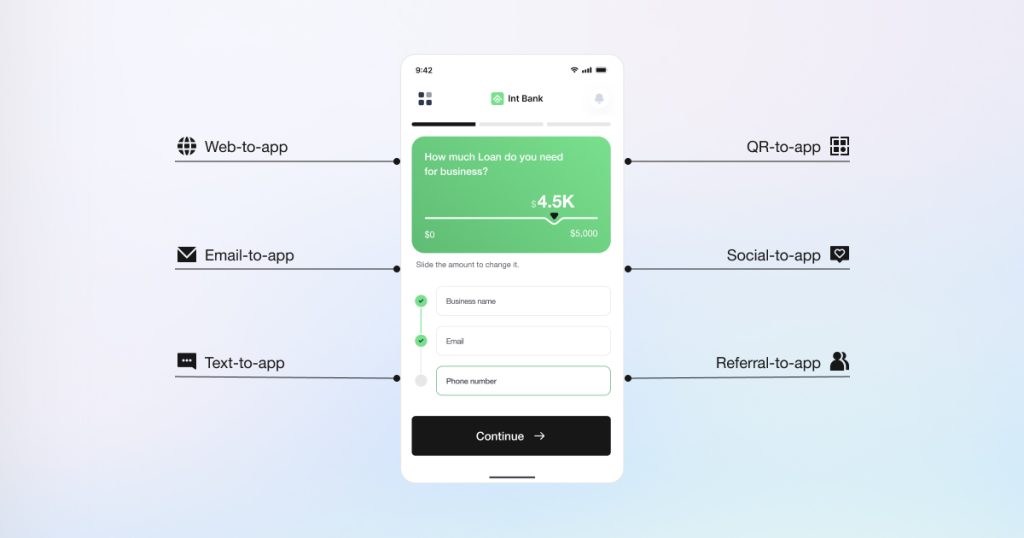
AppsFlyer data shows owned channels outperform paid media significantly. Email-to-app campaigns achieve 17.7% conversion rates. Finance apps in APAC see 17.2% conversions via owned channels versus 7.1% via paid, a 2.4X advantage. Web-to-app conversions surged 77% in 2024. Yet most banks lack the infrastructure to measure and optimize these channels.
Omnichannel attribution: One measurement framework
Omnichannel attribution measures every channel; paid acquisition (Meta, Google, TikTok, Apple Search Ads), owned channels (email, SMS, push), web touchpoints (mobile website, desktop, branch QR codes), and re-engagement campaigns, against the same banking outcomes: deposits, loans, account openings, and lifetime value. This enables direct channel comparison and data-driven budget allocation.
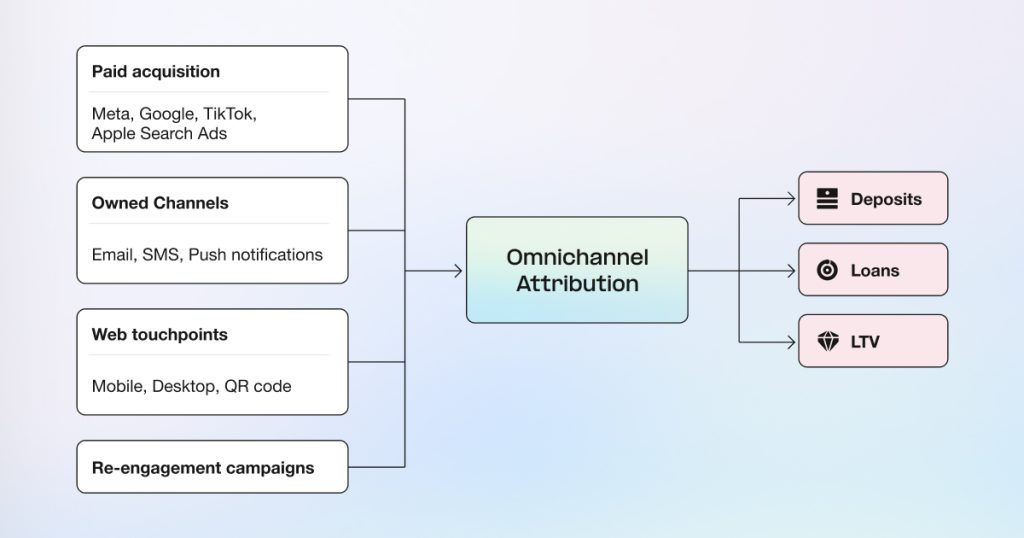
The platform maintains banking-grade compliance: SOC 2 Type II, ISO 27001, and ISO 27701 certified with GDPR and CCPA compliant processing, data residency options, and complete audit trails for regulatory reporting.
7 measurement challenges banks solve with omnichannel attribution
Note: The following scenarios illustrate how banks use omnichannel attribution. Metrics shown are representative examples based on typical customer implementations.
1. Comparing paid acquisition and owned channel efficiency
Business context:
A neobank allocates $3M annually to paid acquisition (Meta, Google, TikTok) and $1.5M to email marketing and SMS campaigns. Leadership questions relative channel efficiency but lacks comparable metrics. Paid acquisition reports cost per install and estimated cost per funded account. Email and SMS report engagement metrics only.
Implementation:
The bank implements omnichannel attribution measuring all channels to funded accounts:
- Integrated email service provider with AppsFlyer via deep links
- Connected SMS platform for campaign attribution
- Unified dashboard showing cost per funded account across all channels
Results:
| Channel | Previous metric | Revenue attribution |
| Paid acquisition | $48 CPI | $187 cost per funded account |
| Email campaigns | 24% open rate | $52 cost per funded account |
| SMS campaigns | 42% click rate | $73 cost per funded account |
Outcome:
The bank reallocated $800K from paid acquisition to scaled email and SMS programs. Maintained account growth volume while reducing blended customer acquisition cost by 34%. CFO approved reallocation based on clear ROI data with data-driven budget optimization based on actual channel performance.
2. Measuring re-engagement campaign effectiveness
Business context:
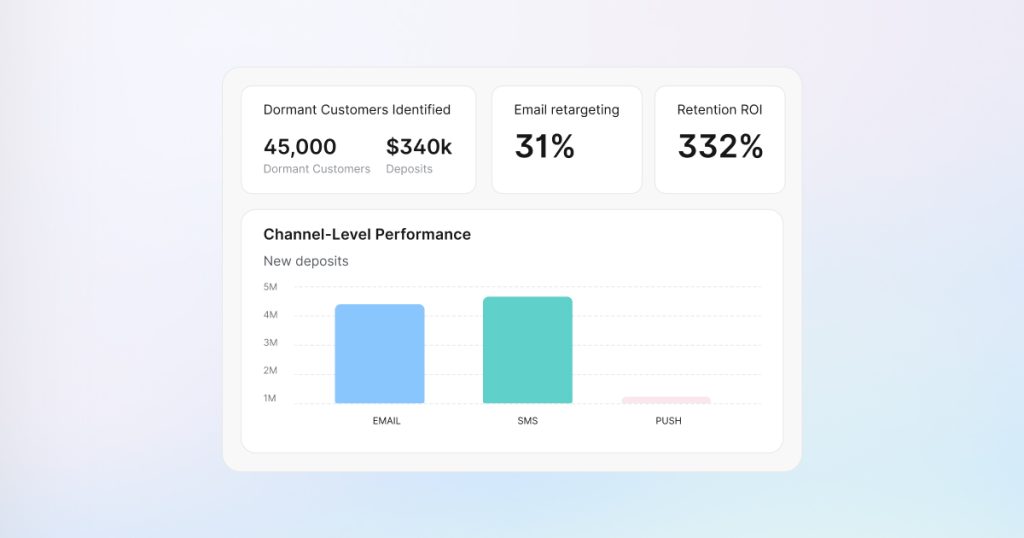
A digital bank identifies 45,000 customers who made multiple deposits in their first 90 days but haven’t logged in for 60+ days. These dormant customers represent $340M in deposits. The retention team launches a win-back campaign offering 4.5% APY on high-yield savings accounts via email and SMS.
Campaign engagement looks strong (31% email open rate, 48% SMS click-through rate), but marketing cannot connect the campaign to actual deposits or calculate return on retention investment.
Implementation:
Re-engagement attribution measuring campaign touchpoints to reactivation and revenue:
- Campaign structure: Two emails + one SMS + push notification retargeting
- Deep links routing to high-yield savings account opening
- Attribution measuring: Campaign send → App reopen → Account opened → Deposit amount
- Channel-level performance measurement
Results:
- Reactivation: 8,400 customers reactivated (18.7% reactivation rate)
- Deposits: $14.2M in new high-yield savings deposits
- Average deposit: $1,690 per reactivated customer
Channel performance:
| Channel | Reactivations | Deposits | Cost per reactivation |
| 4,200 | $7.1M | $42 | |
| SMS | 3,100 | $5.4M | $38 |
| Push | 1,100 | $1.7M | $28 |
Efficiency comparison:
- Re-engagement: $13 cost per $1K deposited
- Paid acquisition: $47 cost per $1K deposited (new customers)
Outcome:
Retention marketing proved 3.6X more cost-efficient than acquisition for driving deposits. The bank secured a budget to scale re-engagement programs 3X in the following quarter. Board presentation included retention ROI alongside acquisition metrics.
3. Optimizing email campaign performance
Business context:
A traditional bank sends 400,000 marketing emails monthly across multiple products: high-yield savings accounts, credit cards, personal loans, mortgage refinancing, and investment accounts. Email team reports consistent engagement (22% open rate, 6% click rate) but cannot connect campaigns to account openings or deposits.
Leadership questions email marketing ROI without revenue attribution. Email budget faces scrutiny during annual planning.
Implementation:
Email attribution with deep linking measuring campaigns to banking outcomes:
- Deep links implemented for each product type
- High-yield savings → Direct to account opening with rate pre-filled
- Credit cards → Application with offer details
- Loans → Calculator and application flow
- Mortgages → Rate comparison and application
- Attribution measuring: Email send → Open → Click → App destination → Account opened/Application submitted → Deposit/Approval
Results:
High-yield savings emails drove 5.8X more account openings and 12X more deposits than credit card emails despite similar engagement metrics (open and click rates were comparable).
The bank adjusted email mix from 20% high-yield savings / 35% credit cards to 45% high-yield savings / 15% credit cards. Same email volume and budget.
AppsFlyer data shows email-to-app campaigns achieve industry-leading conversion rates of 17.7%, the highest among owned media channels, validating email’s effectiveness for driving revenue outcomes.
Outcome:
Monthly deposits attributed to email campaigns increased from $2.4M to $5.8M. Email team proved ROI: Every $1 spent on high-yield savings emails drives $13,300 in deposits. Email budget approved for 40% increase in annual planning.
AppsFlyer data shows email-to-app campaigns achieve industry-leading conversion rates of 17.7%, the highest among owned media channels, validating email’s effectiveness for driving revenue outcomes.
4. Proving SMS campaign ROI
Business context:
A digital bank spends $240K annually on SMS across fraud alerts, payment reminders, promotional offers, and account updates. Finance leadership questions SMS investment because campaigns only report delivery and click rates with no connection to revenue, fraud prevention, or customer retention.
SMS budget faces potential reduction without clear ROI demonstration.
Implementation:
SMS attribution connecting notifications to banking actions:
- Fraud alerts → Deep link to transaction review → Security settings updated
- Payment reminders → Deep link to payment screen → Payment completed
- Promotional loan offers → Deep link to application → Loan approval
- Deposit encouragement → Deep link to funding → Deposit completed
Results by campaign type:
| SMS type | Volume | Click rate | Outcome | Business value |
| Fraud alerts | 180,000 | 72% | 34% updated security | Fraud prevention + trust |
| Payment reminders | 420,000 | 42% | 68% paid immediately | $840K late fee revenue maintained |
| Promotional loans | 50,000 | 38% | 3,500 approvals | $43.4M loan originations |
| Deposit encouragement | 95,000 | 31% | 18% completed deposit | $3.2M deposits |
Total ROI calculation:
- SMS budget: $240K annually
- Attributed outcomes: $43.4M loans + $3.2M deposits + $840K revenue maintained
- ROI demonstrated through attributed loan originations ($43.4M), incremental deposits ($3.2M), and maintained late fee revenue ($840K).
Outcome:
SMS budget increased 40% to scale high-performing campaigns. Finance approved expansion based on clear revenue attribution. Fraud alerts valued for customer trust despite lacking direct revenue (measured through improved retention rates).
5. Measuring web-to-app customer journeys
Business context:
A traditional bank receives 2.8M monthly mobile website visits. Customers research products (mortgage rates, savings accounts, credit cards) on mobile web. Most conversions occur after downloading the mobile app.
Without cross-platform attribution, the bank cannot determine:
- How many app installs begin with mobile web research
- Which website content drives app downloads and conversions
- Whether customers researching on web convert at different rates
- What percentage of deposits involve a web-to-app journey
Marketing attributes conversions solely to the install source (paid ads or organic), missing the web research component.
Implementation:
Web-to-app attribution connecting mobile website activity to app conversions:
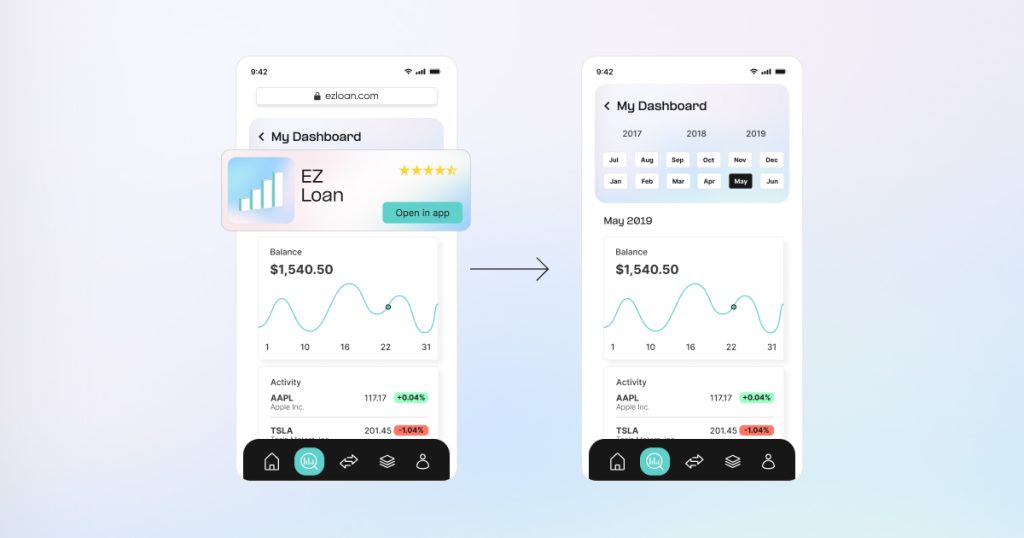
- AppsFlyer Web SDK implemented on mobile website
- Smart Banners deployed to guide mobile web visitors to app
- Cross-platform attribution connecting web sessions to app installs
- Journey measurement: Web visit → Content engagement → Smart Banner interaction → App install → Account opening → Deposit
Results:
- AppsFlyer data shows web-to-app conversions surged 77% in 2024 compared to 2023, with Finance apps leading the charge at over 200% year-over-year growth. This dramatic increase reflects growing recognition that mobile website interactions drive app adoption.
- Web-to-app users demonstrated 2.1X higher first deposit rate compared to direct app installers
- Average deposit amount 38% higher for web-to-app journey customers
- Median time from web visit to first deposit: 4.2 days
Content performance analysis:
| Web content | App download rate | Conversion within 30 days |
| Mortgage calculator | 34% | 18% apply for mortgage |
| Savings rate comparison | 47% | 28% open savings account |
| Credit card comparison | 29% | 12% complete application |
Many deposits involved a web-to-app journey. Customers researching on mobile web before downloading demonstrated significantly higher lifetime value. Previous attribution had credited these conversions entirely to paid ads (the install source), undervaluing web content contribution.
Outcome:
The bank adjusted attribution model to credit web touchpoints. Content team optimized high-performing calculators and comparison tools. Smart Banner implementation refined to improve web-to-app conversion. Web-to-app conversion improved 23%. Marketing mix model updated to properly value both web content and paid acquisition in customer journeys. Budget allocation adjusted to invest more in high-performing web content.
6. Branch QR code attribution
Business context:
A traditional bank with 340 branches provides QR codes on tablets and printed materials for account opening, appointment scheduling, and loan applications. Branch management believes QR codes facilitate digital engagement, but the bank lacks measurement for:
- QR code scan rates
- Scan-to-install conversion
- Account openings attributed to branch QR codes
- Performance variation across branches and placements
Digital banking team questions QR code program ROI without performance data.
Implementation:
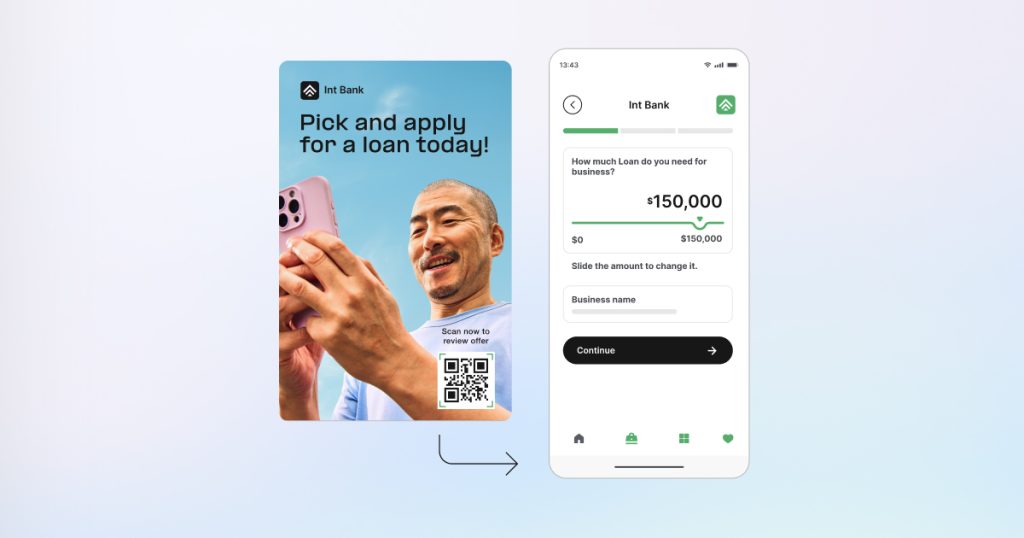
QR code attribution measuring branch-to-app journeys:
- Unique QR codes generated for each branch and scenario type
- Checking account QR → Deep link to checking account opening
- Savings account QR → Deep link to high-yield savings signup
- Loan QR → Deep link to loan calculator and application
- Appointment QR → Deep link to branch appointment scheduling
- Attribution measuring: QR scan → App store (if app not installed) → App install → Account opening → Initial deposit
- Branch-level and placement-type performance analysis
Results:
Quarterly results (340 branches):
- Total scans: 47,200
- App installs: 18,900 (non-app users, 40% conversion rate)
- App opens: 28,300 (existing app users, 60% of scans)
- Accounts opened: 8,470 (18% of total scans)
Account distribution:
- Checking accounts: 4,720 (56%)
- High-yield savings: 2,910 (34%)
- CDs and other products: 840 (10%)
Average initial deposits:
- QR-attributed accounts: $2,840
- All new accounts (all sources): $1,960
- Difference: 45% higher initial deposits from QR-attributed accounts
Performance by placement type:
| Placement | Scan rate | Conversion insight |
| Tablet (banker presents) | 67% | Highest conversion; personal explanation |
| Counter display | 28% | Moderate conversion; self-service |
| Printed take-home | 12% | Lowest conversion; delayed action |
Branch performance analysis:
- Top 10% of branches generated 34% of total scans (correlation with staff training and engagement)
- Bottom 25% of branches generated 8% of scans (opportunity for improvement)
AppsFlyer data shows QR-to-app campaigns achieve 16.6% conversion rates, demonstrating strong performance for offline-to-online attribution.
ROI calculation:
- QR program cost: $85K (design, materials, tablets, training)
- Accounts opened: 8,470
- Deposits: $24M
- Comparison: At paid acquisition rate of $187 per funded account, equivalent acquisition would cost $1.58M
- Savings: $1.5M
Outcome:
QR program expanded to all branches with focus on tablet presentation (67% scan rate vs. 12% for printed materials). Underperforming branches received additional training based on best practices from top performers. Branch network transitioned from questioning digital investment to requesting additional QR code capabilities for cross-sell opportunities.
7. Attributing cross-device customer journeys

Business context:
A regional bank spends millions annually on mobile paid acquisition (Meta, Google, TikTok). Desktop analytics show for eg. 840 monthly account openings with strong deposit amounts. Leadership celebrates desktop as the highest-converting channel.
The CFO questions mobile investment. Desktop appears to drive better conversions organically. The performance marketing team faces a 35% budget cut.
Nobody can answer: How many desktop conversions started with a mobile ad?
Attribution measures mobile and desktop separately. A customer sees an Instagram ad during their commute, opens an account on desktop that evening. The data shows an organic desktop conversion. The mobile ad gets zero credit.
Implementation:
Cross-device attribution connecting journeys across mobile web, desktop web, and app:
- AppsFlyer Web SDK on mobile and desktop website
- Deterministic matching via logged-in user identification
- Journey monitoring: Mobile ad → Desktop research → Conversion
- Multi-session measurement across devices
Results:
Desktop account openings (2,520 total):
- Same-device desktop journeys: 1,460 (58%)
- Started with mobile touchpoint: 1,060 (42%)
Mobile touchpoint breakdown:
- Mobile paid ads (within 7 days): 680 conversions
- Mobile web research: 240 conversions
- Mobile app exploration: 140 conversions
Average journey: Mobile ad → 2.8 days → Desktop conversion
Reverse pattern (mobile app conversions): 1,840 total, 590 (32%) started with desktop research.
Product-specific cross-device rates:
- High-yield savings: 48% cross-device
- Mortgages: 67% cross-device
- Investment accounts: 71% cross-device
Channel performance recalculation:
Before cross-device attribution:
- Mobile paid acquisition: $38 CPI, unclear account impact
- Desktop: 840 monthly conversions (assumed organic)
After cross-device attribution:
- Mobile paid acquisition: $142 cost per funded account, driving 27% of all openings
- Desktop organic: 580 conversions (not 840)
Outcome:
Marketing and finance aligned on channel performance. CFO understood mobile ads drove desktop conversions. The bank launched coordinated cross-device campaigns. Desktop pages optimized for mobile ad viewers. Conversion rates improved 18%.
Most critically: avoided cutting 680 monthly account openings and $2.4M in monthly deposits invisible in single-device attribution.
The bottom line
Your customers move across channels and devices. Your measurement should too.
Without unified attribution, banks can’t confidently answer critical questions: Which channels drive deposits? Is retention more efficient than acquisition? How many desktop conversions start on mobile?
The seven scenarios above show what becomes possible with complete measurement: email campaigns delivering 3.6X better efficiency than paid ads, re-engagement costing $13 per $1K deposited versus $47 for acquisition, and cross-device attribution revealing mobile drives 27% of account openings, insights that prevent multi-million dollar budget mistakes.
AppsFlyer provides secure, banking-grade infrastructure for measuring marketing performance across every channel. Whether you’re optimizing established digital banking or beginning transformation, omnichannel attribution connects paid acquisition, owned channels, web, QR codes, and re-engagement to real banking outcomes while maintaining compliance (SOC 2, ISO 27001, GDPR, CCPA).
Book a demo or speak to our team to discover how AppsFlyer helps banks prove marketing ROI across every touchpoint.
Key takeaways
- Prove which channels drive deposits and loans with revenue attribution across every touchpoint
- Compare email, SMS, and re-engagement ROI directly against paid acquisition using cost per deposit
- Unlock 2X better cost efficiency by scaling owned channels over paid ads
- Capture cross-device journeys to credit mobile campaigns for desktop conversions
- Optimize budget allocation using actual channel performance data
- Quantify offline-to-online impact of branch QR codes and in-person touchpoints
- Maintain banking-grade compliance while measuring every marketing touchpoint
Ready to measure marketing ROI across your complete channel mix? Discover how AppsFlyer’s omnichannel attribution helps banks connect every touchpoint to revenue.
Frequently asked questions
It measures all your marketing channels with the same metric: cost per deposit. So you can finally compare paid acquisition, email campaigns, SMS, push notifications, and re-engagement programs side by side. You see which channels actually drive deposits and loans, not just app downloads or engagement.
Absolutely. You identify dormant customers, send win-back campaigns, and we measure: who reopens the app, who opens new accounts, how much they deposit. You prove retention campaigns deliver better ROI than acquiring new customers.
Yes. Lots of banking customers see your ad on mobile but open accounts on desktop (or vice versa). We connect those journeys through logged-in user identification. Someone sees your Instagram ad Tuesday morning, logs into desktop banking Tuesday night, opens an account. We attribute that desktop conversion back to the mobile ad. Without this, you’d think it’s an organic desktop conversion and miss that your mobile campaign started the journey.
Everything shows up in one dashboard with the same metrics. Cost per funded account from Meta sits right next to cost per funded account from email. No more comparing CPI from paid ads against open rates from email. You’re comparing deposits to deposits.
We’re SOC 2 Type II and ISO 27001 certified (banking security standards). GDPR and CCPA compliant. No personal customer data in attribution links. Data residency options if you need data stored in specific regions. Your compliance team can review our certifications.