See your complete marketing picture
Transform fragmented data into total visibility tailored to your business. Unite every metric from every source, build dashboards that match how you work, and get AI insights that understand your unique goals.
Request a demo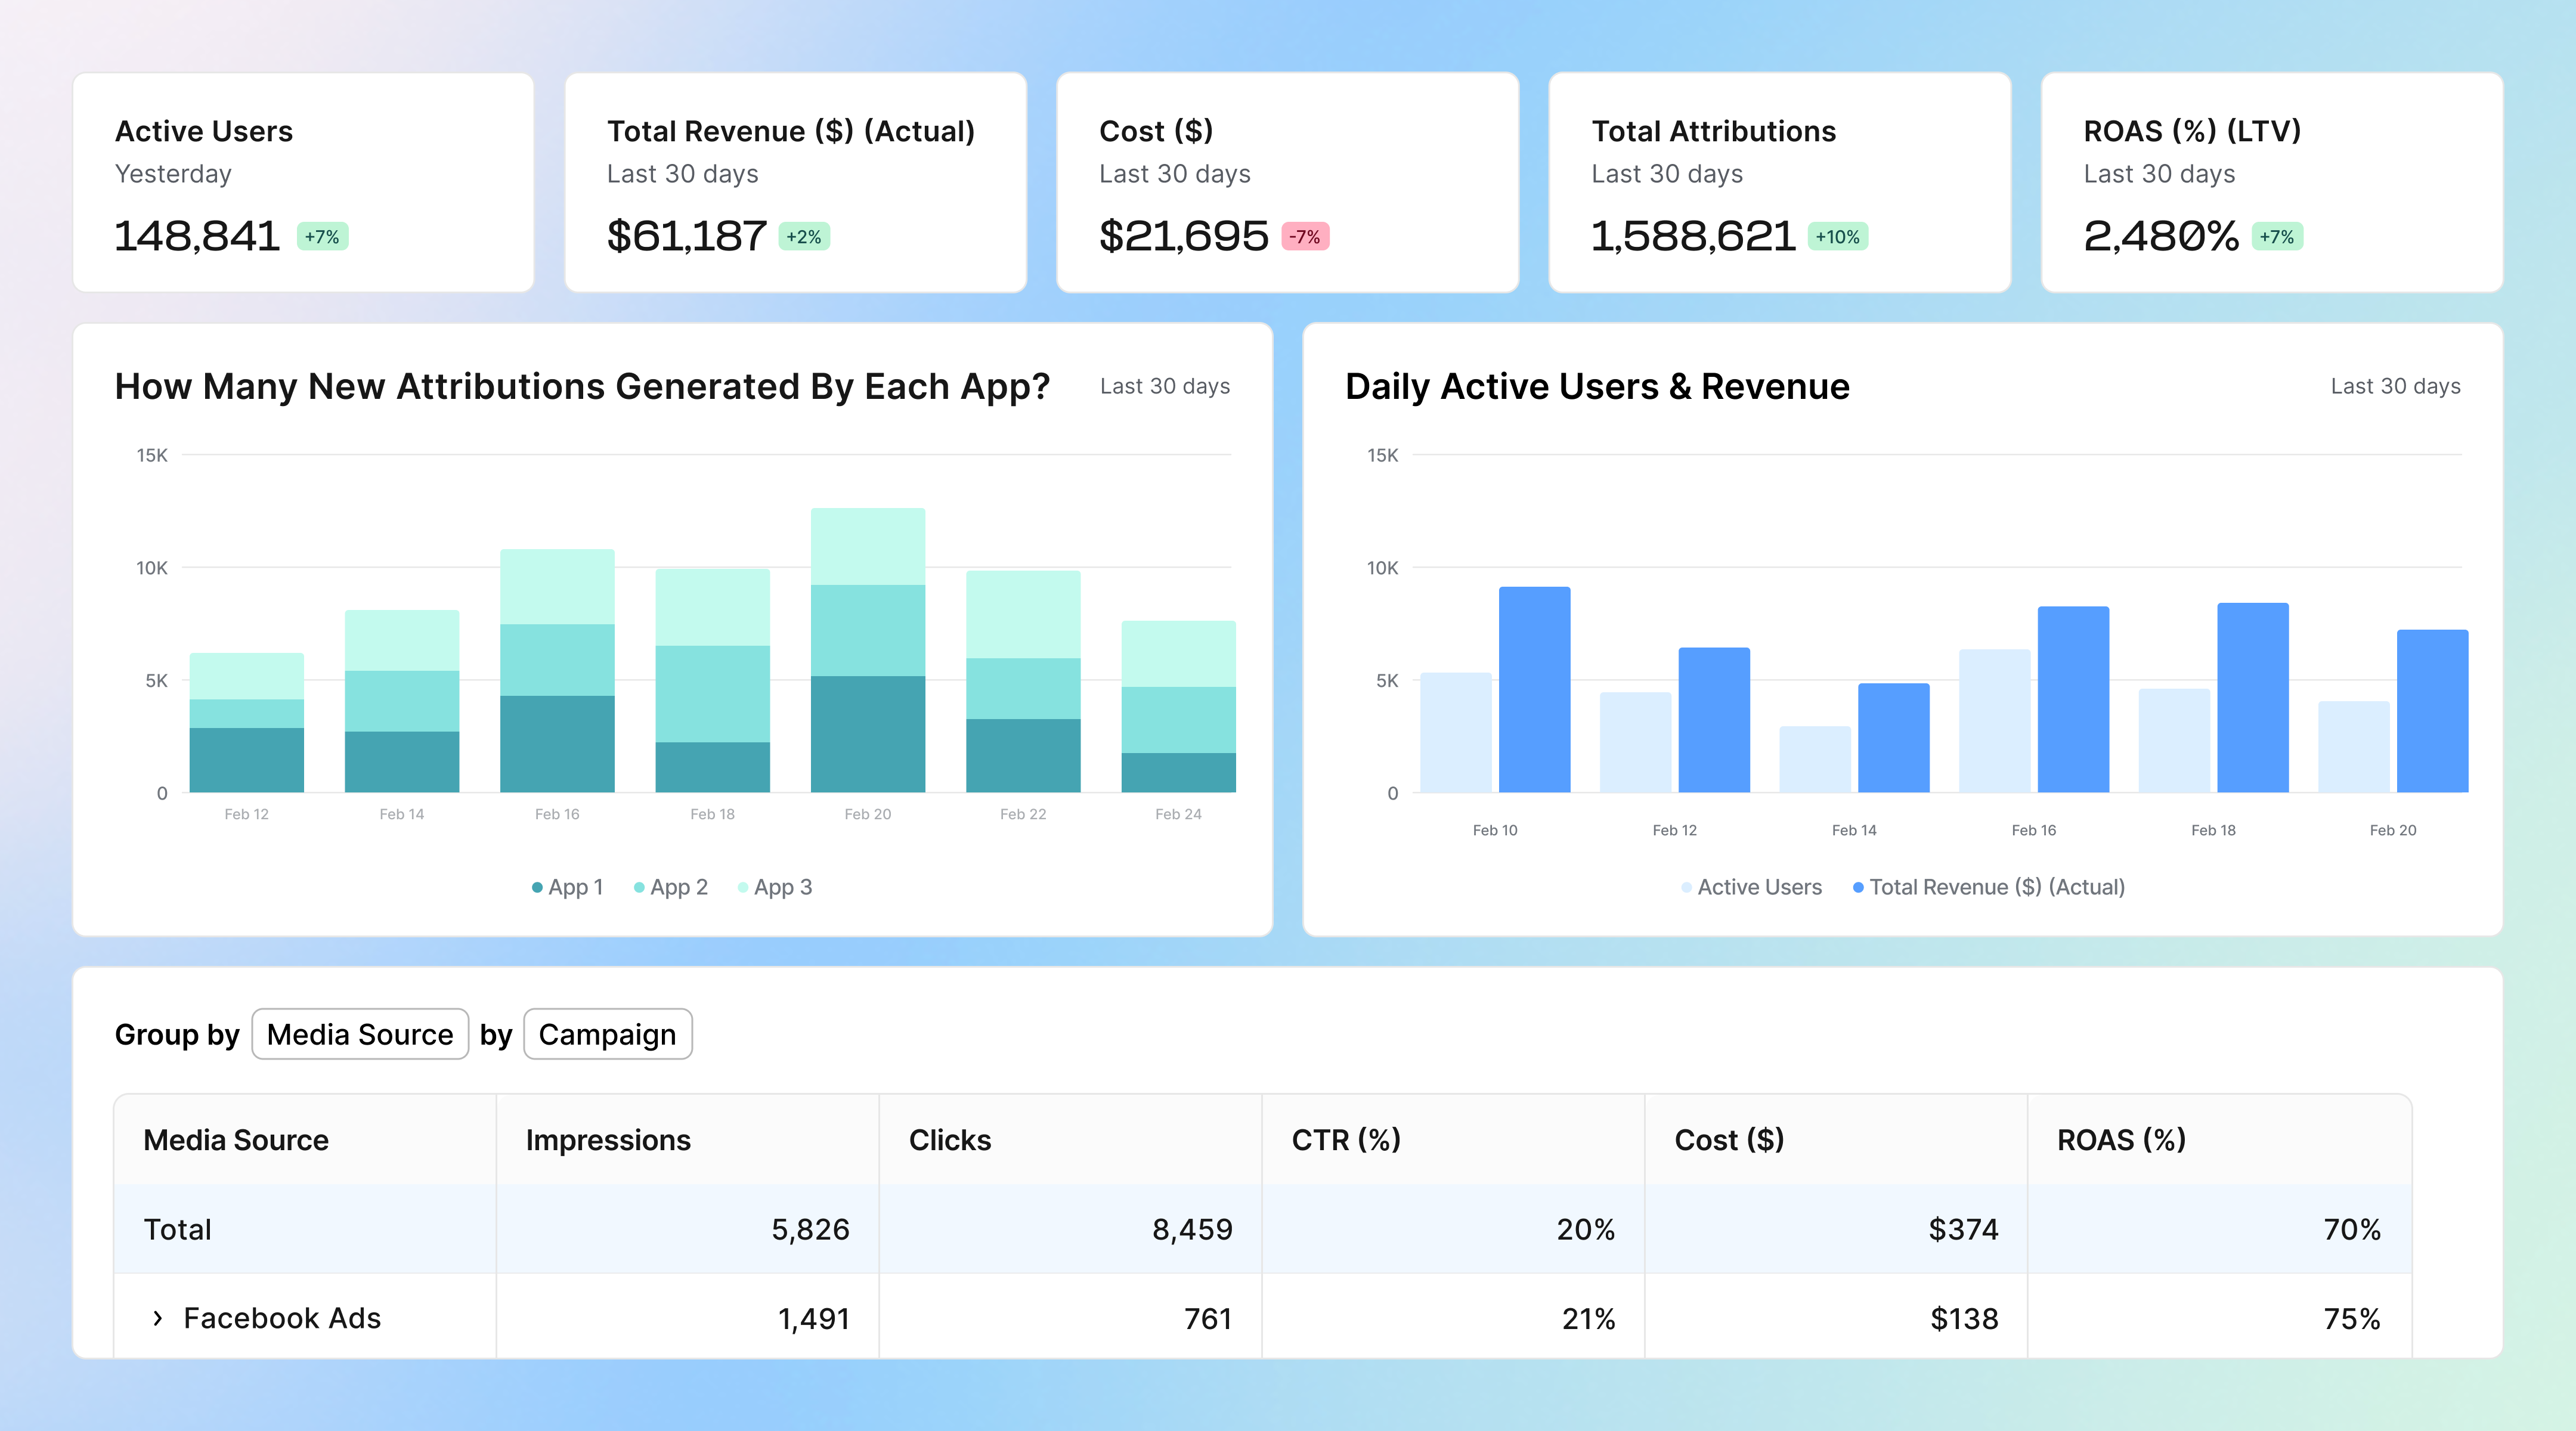
Built for teams that need answers fast
Focus on metrics that drive growth
Build dashboards that match your unique KPIs. Visualize exactly what matters – from ROAS by geo to LTV by creative – enabling faster optimization decisions without waiting for BI support.

Get every metric from every source in one place
Unite fragmented data from 100+ sources in one view. Compare mobile, web, CTV, and PC performance side-by-side, eliminating spreadsheet stitching and ensuring everyone works from the same truth.

Get instant answers with AI
Ask your data questions in plain language and get immediate insights. Query “Which campaigns drove $100+ LTV users?” or “Why did CPA spike yesterday?” – your AI assistant surfaces answers in seconds.

Everything you need to make data-driven decisions
Combine activity data with cohort and LTV metrics for deep insights. Track DAU and MAU accurately including retargeting efforts, aligning all key metrics in unified dashboards that reveal true user behavior patterns.
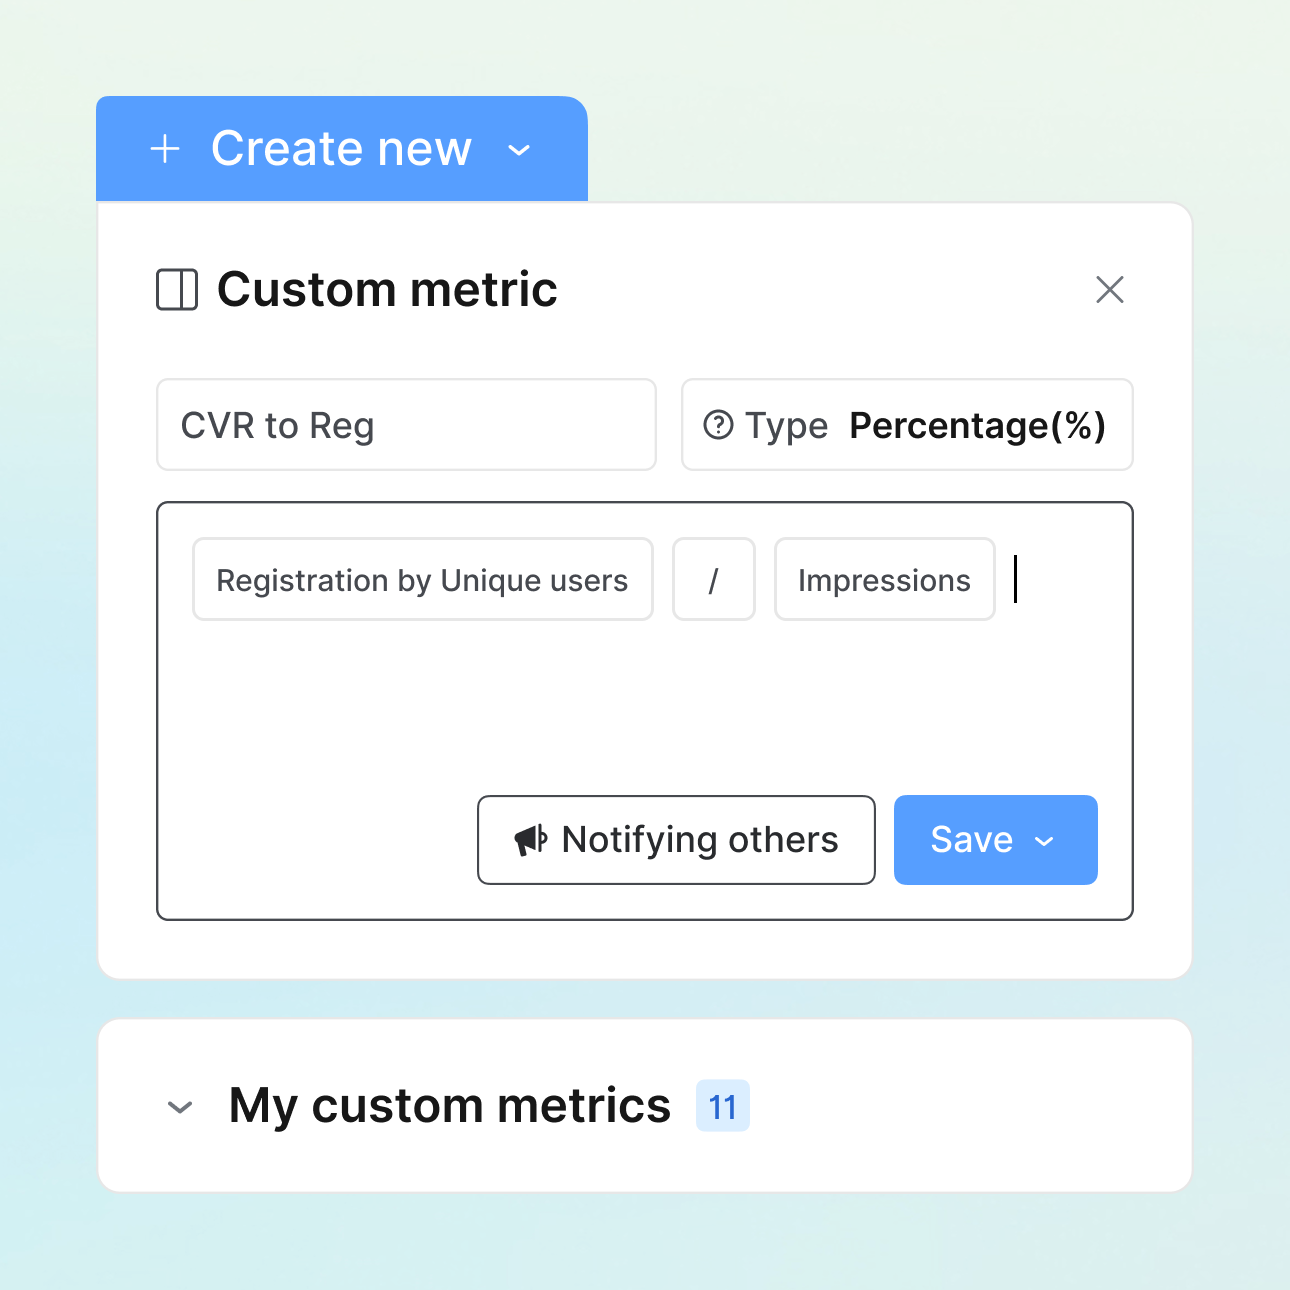
Measure what matters to your unique business. Create metrics that match your specific KPIs and goals, empowering teams to optimize based on real impact rather than generic benchmarks.
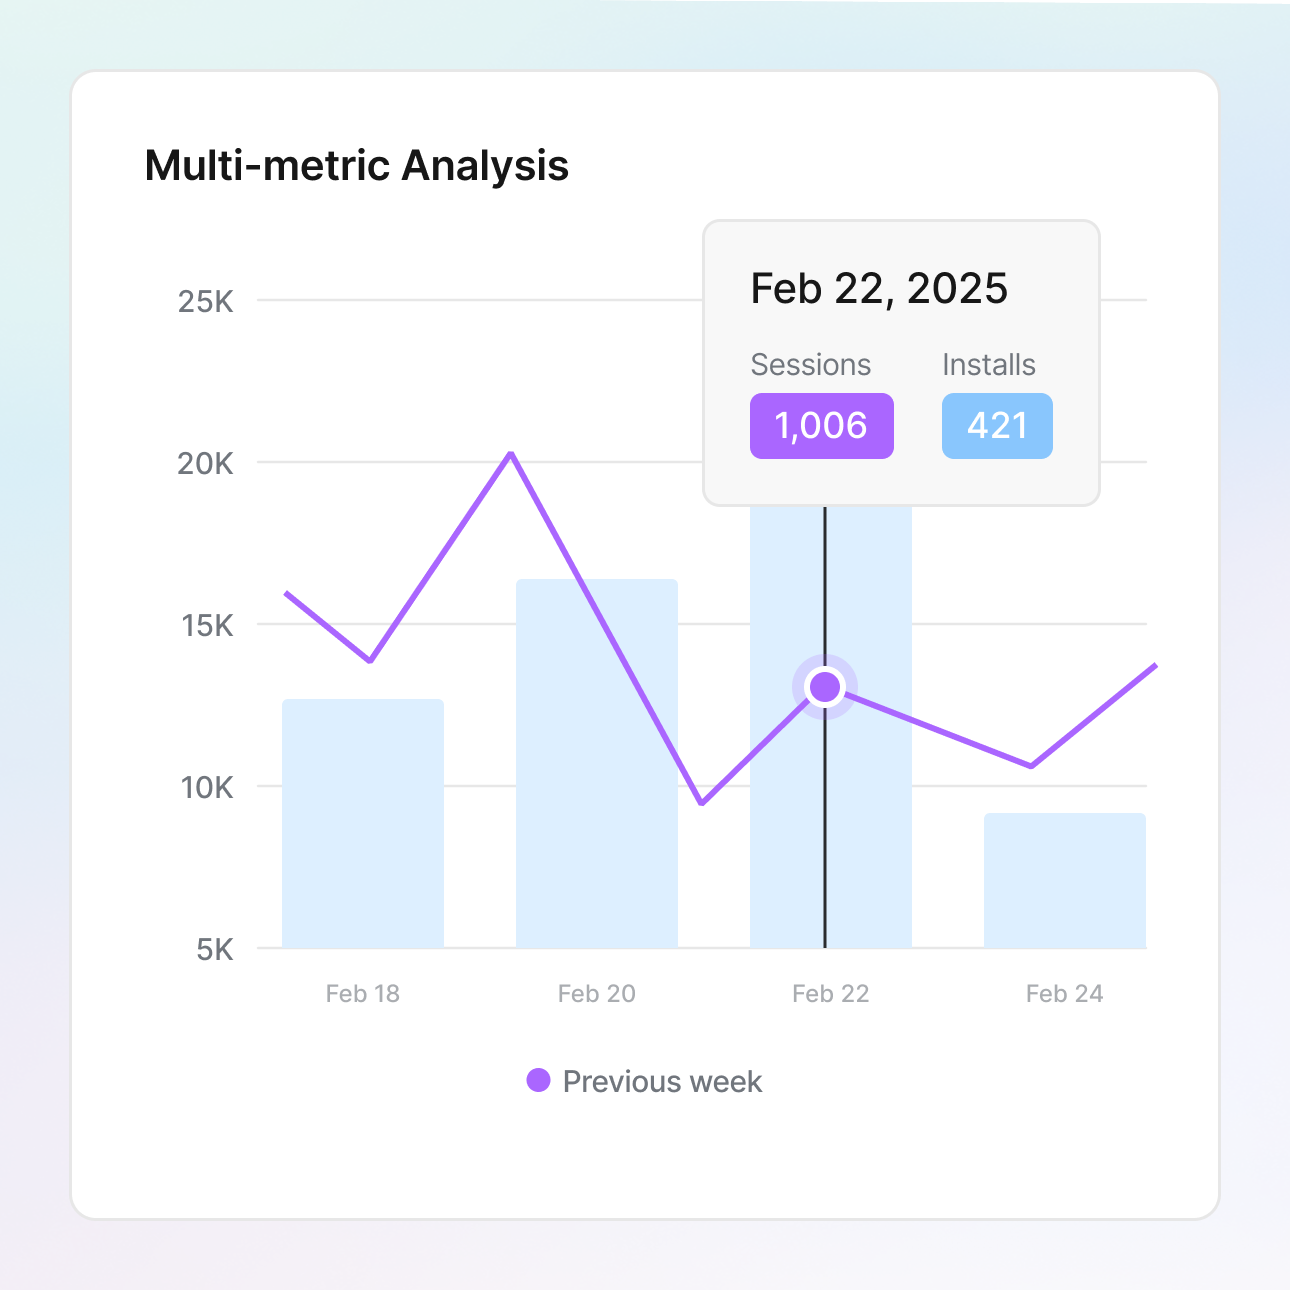
Understand how metrics influence each other. See how impressions drive installs, measure cost efficiency, and measure spend relationships – all in one powerful view that maximizes ROI.
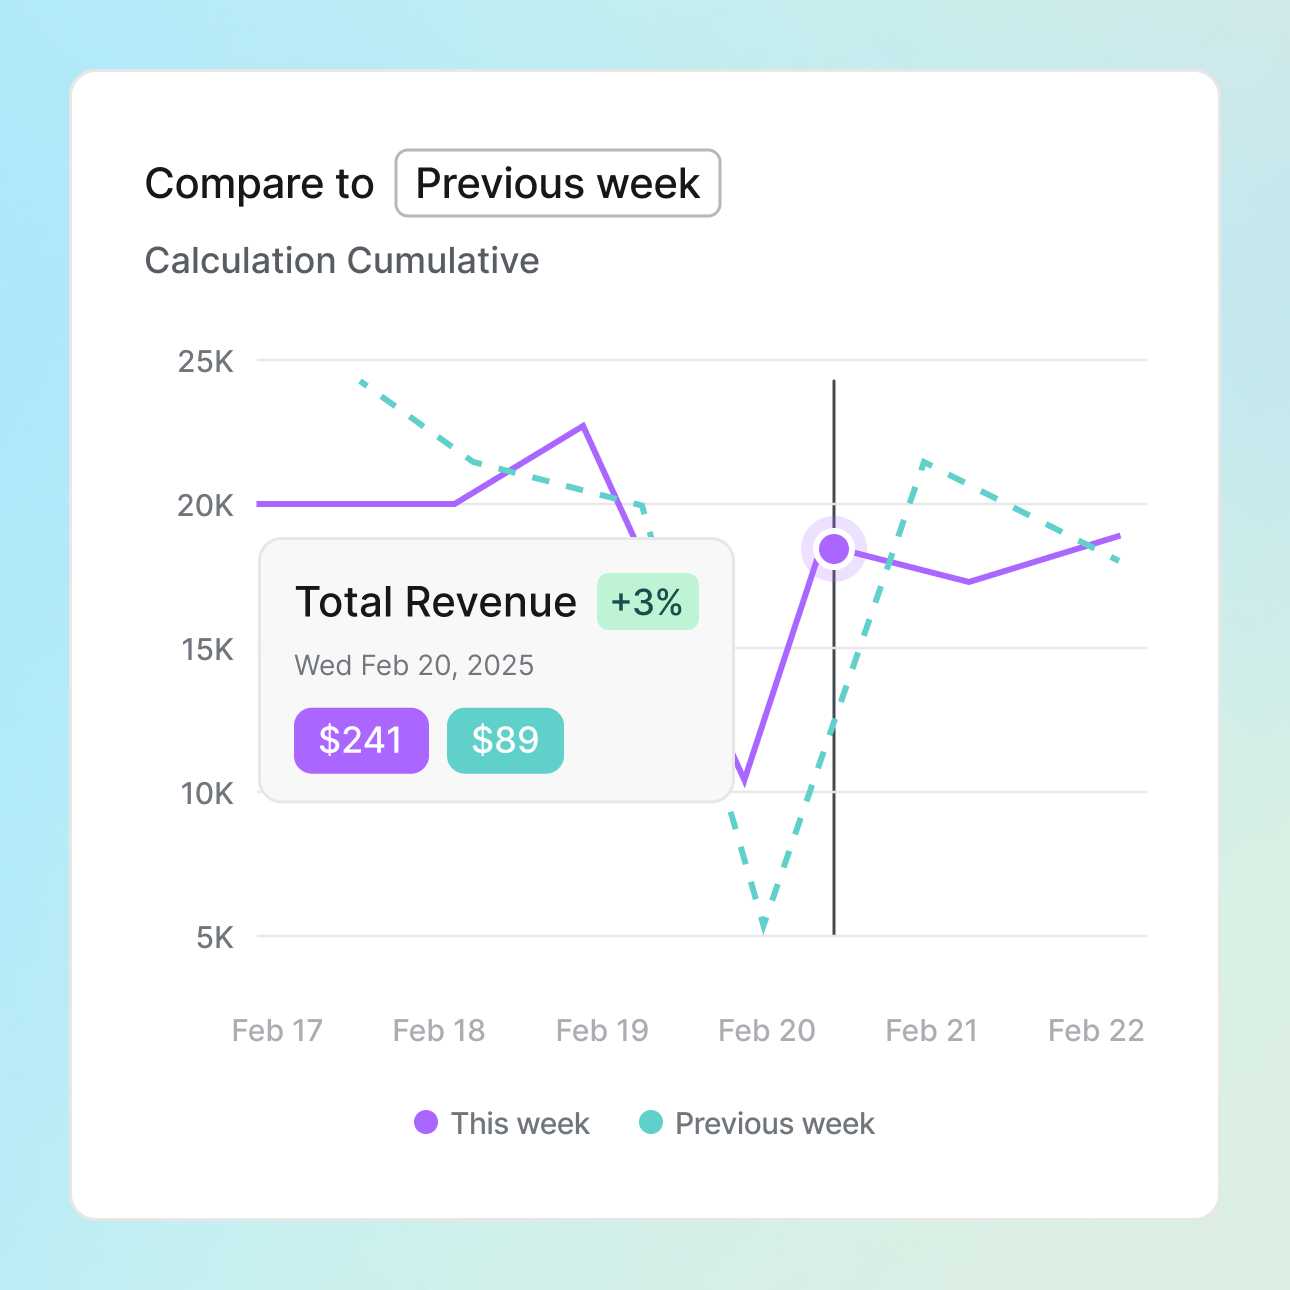
Compare current performance to any past period seamlessly. Identify trends, spot anomalies, and answer business questions faster with flexible date ranges that reveal campaign evolution over time.
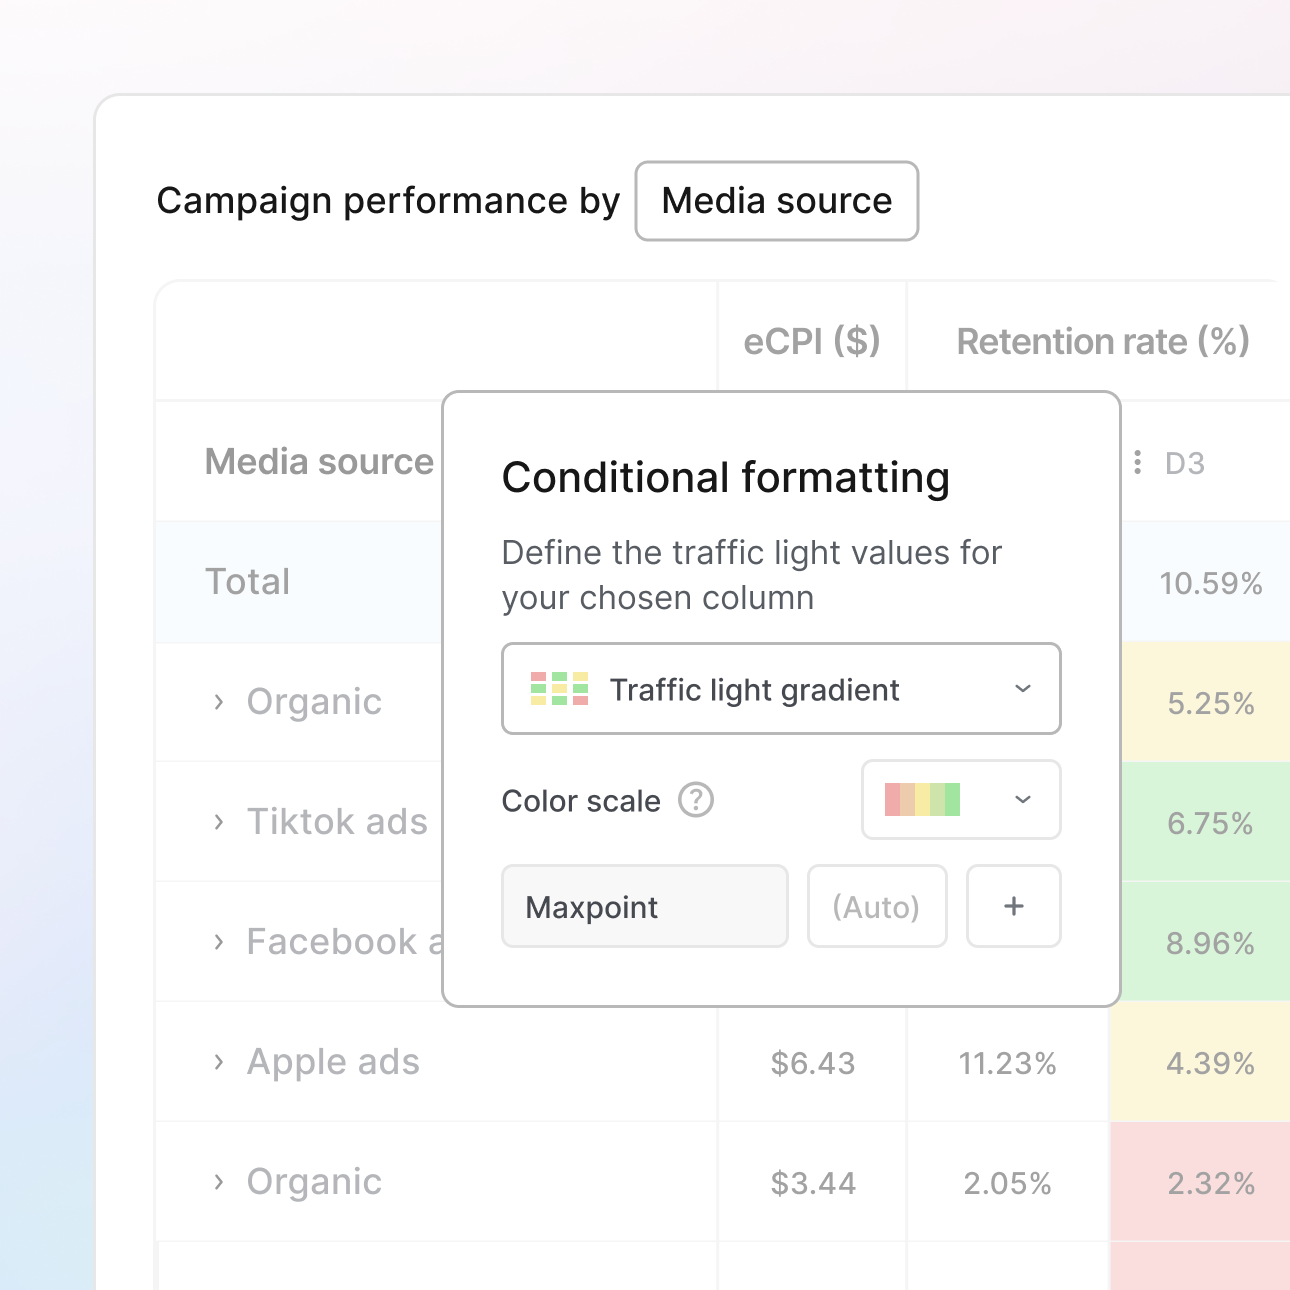
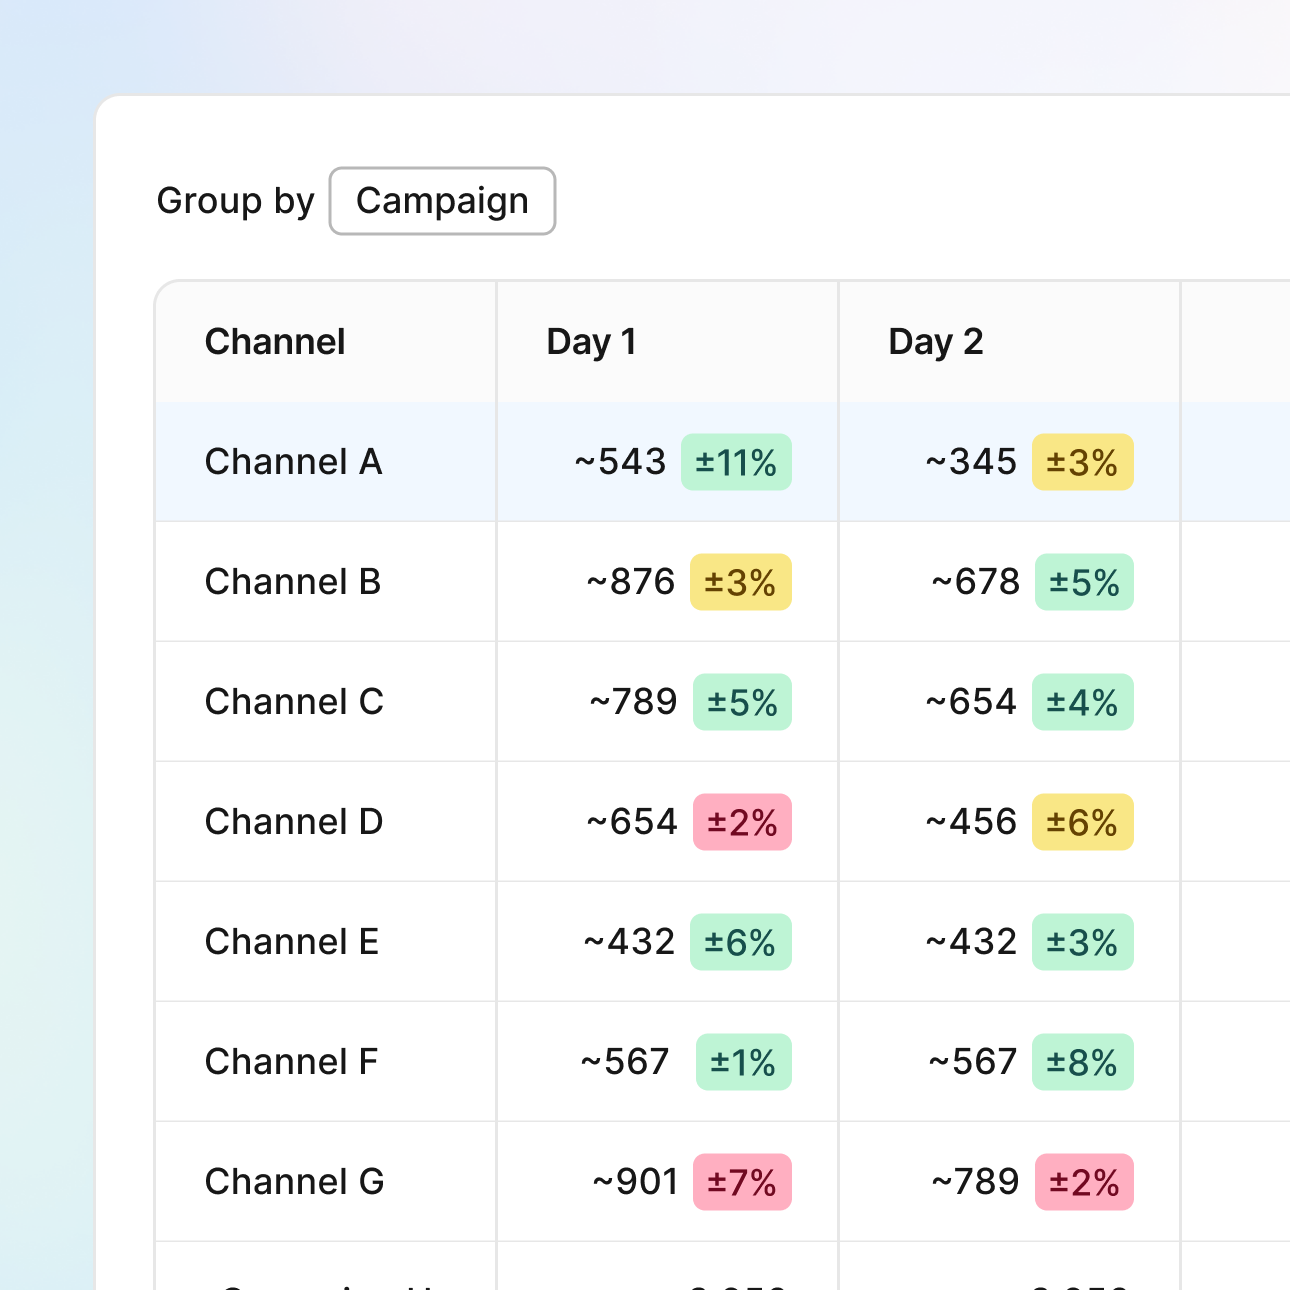
Identify high and low performers instantly with intelligent visualization. Apply color rules, value thresholds, and metric-specific filters to highlight what matters most without scanning endless numbers.

Transform data questions into instant answers. Break down complex metrics, solve setup challenges, or understand what numbers really mean – simply ask and get insights that drive confident action.


“With AppsFlyer, we automated manual tasks and scaled campaign performance effectively.”

“AppsFlyer provided us with the insights needed to optimize our UA strategy effectively.”
Frequently asked questions about marketing analytics
Complete your measurement kit
Discover how other products in AppsFlyer’s Measurement Suite can enhance your marketing performance and ROAS.


