

Marketing attribution: what it is and how to measure it
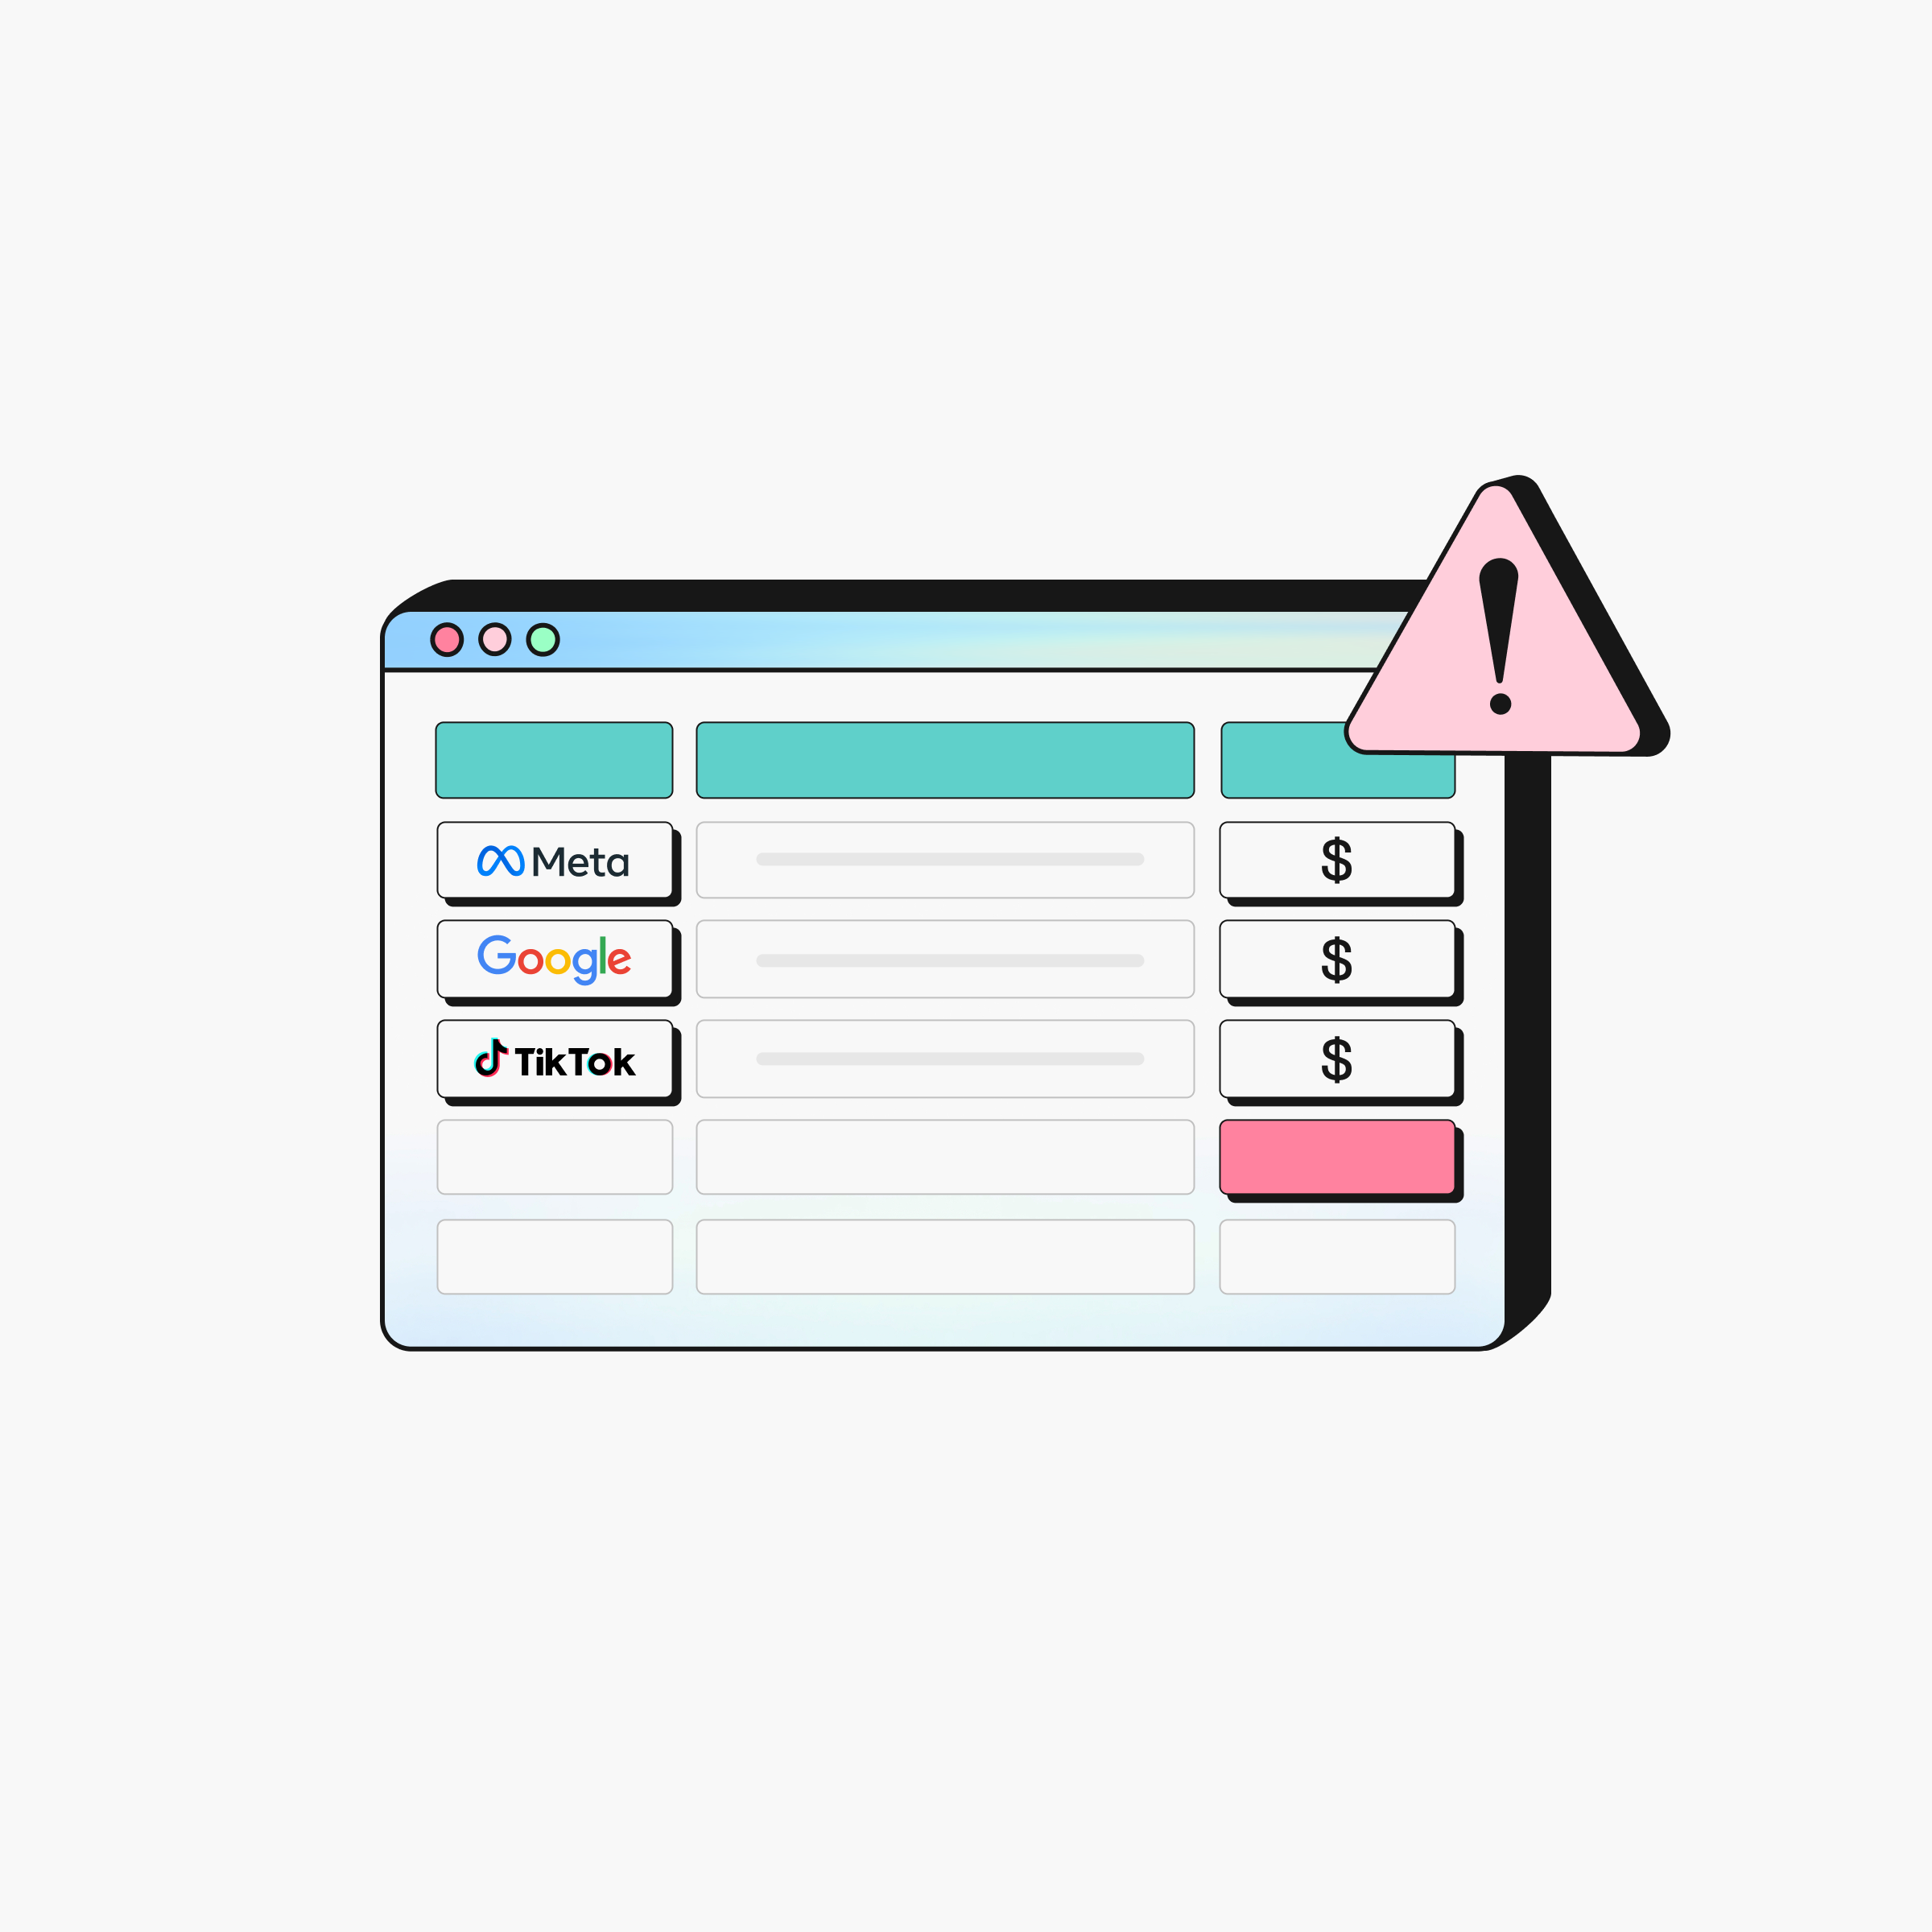

You’re spending across paid social, search, CTV, push, and email, and every channel reports a different number. None of them match, and your BI team is merging spreadsheets at 11pm before the quarterly review still doesn’t get you a straight answer to what actually drove revenue this quarter.
That’s not a data problem. It’s an attribution problem, and fixing it changes every budget decision downstream. Here’s what attribution actually is, how the models differ, and how to set up measurement that gives you numbers you can trust.
TL;DR
- Marketing attribution is how you figure out which channels and campaigns actually drove a conversion
- Without it, budget decisions are based on last-click bias or whichever platform reports the highest numbers
- Single-touch models are fast to set up but miss most of the journey; multi-touch models are more accurate but require more data
- Mobile marketing attribution has constraints that generic web tools cannot handle: ATT, SKAdNetwork, and cross-platform identity gaps
- Clean attribution data is the foundation for AI-driven optimization. Bad signals in, bad decisions out.
What is marketing attribution?
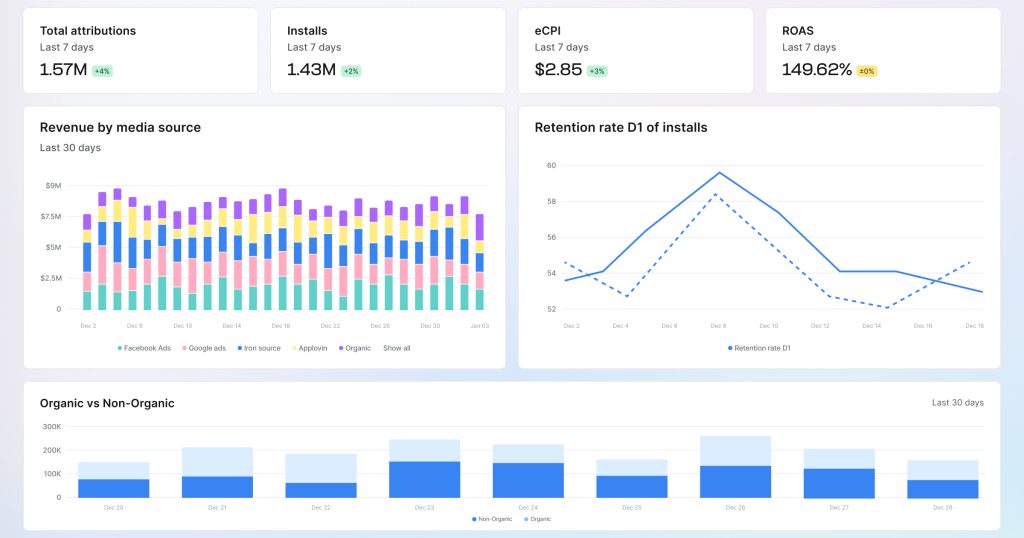
Marketing attribution is how you figure out which channels and campaigns drove a customer to convert.
A customer sees a TikTok ad, searches your brand a week later, clicks a Google result, gets a push notification, and installs your app. Attribution decides which of those interactions gets credit for the conversion, and how much.
It sounds simple. In practice it is one of the most difficult problems in performance marketing. Every platform, from paid social and search to CTV and retail media, claims as much credit as possible for itself. Without an independent measurement layer, you are relying on self-reported numbers from channels with an obvious incentive to over-report.
Why does marketing attribution matter?
Without it, every channel looks equally valuable, or equally useless, depending on which dashboard you open.
Here is what happens in practice. A customer sees a Meta ad on Monday, ignores it. Thursday, a YouTube pre-roll. Still nothing. Saturday, they search your brand on Google, click an organic result, and install. Google reports an organic install. Meta and YouTube report zero. The campaign that introduced your brand gets cut. Budget moves to the last-touch channel that had the least work to do.
That is last-click bias, and it distorts budget decisions across every team that runs multi-channel campaigns. In 2026 the problem is wider than ever: CTV campaigns with no closed attribution loop, retail media sitting behind walled gardens, AI-driven discovery surfaces with no measurement layer at all. Every new channel adds another blind spot.
For mobile teams the gap is structural. Campaigns span paid social, search, push, email, organic, and influencer across iOS, Android, web, CTV, and retail media. Attribution is the only thing that connects app installs and in-app events back to the spend that drove them.
Which attribution model should you use?
Attribution models are the frameworks that determine how credit is distributed across touchpoints. Two categories exist: single-touch and multi-touch.
Single-touch models assign all credit to one interaction. Fast to implement and easy to explain, but they produce a distorted picture.
First-touch gives 100 percent credit to the first interaction, useful for understanding which channels create awareness, but it ignores everything that followed. Last-touch gives full credit to the final interaction before conversion. The most common default in ad platforms, and the most likely to mislead: the channel that gets the tap is often the one that did the least work. Last non-direct strips out direct traffic and gives credit to the last paid or organic channel. Lead conversion touch credits the touchpoint that captured a lead, such as an email signup.
Multi-touch models spread credit across the journey. They require more data and infrastructure but give a more complete view.
Linear attribution gives every touchpoint equal weight. Simple, but it assumes a CTV impression and a final click had identical impact. Time-decay weights touchpoints closer to conversion more heavily, which is right for short purchase cycles. Position-based (U-shaped) gives the most credit to the first and last touch and distributes the rest across the middle, a practical balance for most paid acquisition funnels. W-shaped adds a third heavily weighted point, typically a key engagement moment, better for longer sales cycles. Data-driven attribution uses machine learning to assign credit based on actual conversion patterns. The most accurate model when you have the data volume to support it.
View-through attribution (VTA) is worth a specific mention because most guides omit it. VTA credits a campaign when a customer saw an ad without clicking, then converted later through a different path. Essential for measuring CTV and upper-funnel display, where click-through rates are low but the channel still drives downstream results.
| Model | Best for | Limitation | Requires MMP |
|---|---|---|---|
| First-touch | Brand awareness measurement | Ignores the full journey | No |
| Last-touch | Simple conversion tracking | Last-click bias | No |
| Linear | Equal-weight journey view | Assumes equal impact | Recommended |
| Time-decay | Short purchase cycles | Undervalues awareness | Recommended |
| Position-based (U-shaped) | Balanced first and last touch | Middle journey still simplified | Recommended |
| Data-driven | Most accurate at scale | Requires large data volumes | Yes |
| View-through | CTV and upper-funnel display | Hard to isolate from other channels | Yes |
How do you set up marketing attribution?
Most guides cover the theory. Here is how you actually implement marketing attribution in practice.
Step 1: Define your conversion events.
Decide what counts as a conversion before you instrument anything. For a mobile app: install, first purchase, subscription activation, or a key in-app event. For a web funnel: form fill, demo request, completed transaction. Attribution is only as useful as the events it measures.
Step 2: Tag every campaign with UTM parameters.
Every paid link, email, and attributable source needs consistent UTM parameters: source, medium, campaign, content, term. Mixing “facebook” and “Facebook” and “fb” across campaigns produces data that cannot be reconciled. Set a naming standard and apply it everywhere before you launch anything.
Step 3: Instrument your SDK or pixel.
For web campaigns, place a pixel on every page that matters and confirm it fires on actual conversion events, not just page loads. For mobile apps, integrate your MMP’s SDK and pass conversion events through it. Test before you trust the data.
Step 4: Choose your attribution model.
Based on your funnel complexity and data volume, pick a model from the section above. Starting from zero? Position-based is usually the most practical choice. It acknowledges acquisition and conversion without requiring the data volume that data-driven attribution demands.
Step 5: Select your measurement platform.
For mobile campaigns, a mobile measurement partner (MMP) is not optional. It is the infrastructure that makes accurate attribution possible. An MMP applies consistent logic across mobile, web, CTV, and retail media, deduplicates conversions so Meta and Google cannot both claim the same install, and acts as an independent referee between you and the platforms reporting into your stack. A modern MMP also feeds clean, deduplicated data into automated optimization tools, including agentic AI systems that adjust bids and reallocate budgets without manual intervention.
Step 6: Set your attribution windows.
An attribution window is the time period after an ad interaction during which a conversion can be credited to that ad. A common default is seven days after a click and one day after a view. Set windows that match your actual purchase cycle. A mobile game with a two-minute time-to-install needs a different window than an app with a 30-day trial period.
Step 7: Validate, then keep validating.
Compare your MMP data against platform-reported numbers regularly. Gaps are normal. They reflect the difference between self-reported and independently measured attribution. Unexplained discrepancies signal an instrumentation problem. Run incrementality testing alongside attribution to confirm that the channels receiving credit are actually driving conversions, not just correlating with them.
Why is mobile attribution harder than web attribution?
Generic attribution guides are written for web funnels. Mobile operates under different constraints that web tools cannot address.
ATT changed attribution structurally. SKAN changed how signal quality works. Cross-platform attribution created an entirely separate identity problem. Each one requires a different fix.
iOS 14.5 and App Tracking Transparency (ATT)
Apple’s ATT framework lets iOS customers opt out of device-level measurement. When they do, the IDFA, the identifier that powered deterministic attribution, is unavailable. Without an MMP’s probabilistic modeling to fill the gap, brands relying on rigid, device-ID-only attribution can see a significant share of paid installs default to organic classification, creating a ripple effect across customer acquisition cost, ROAS, and LTV.
SKAdNetwork (SKAN)
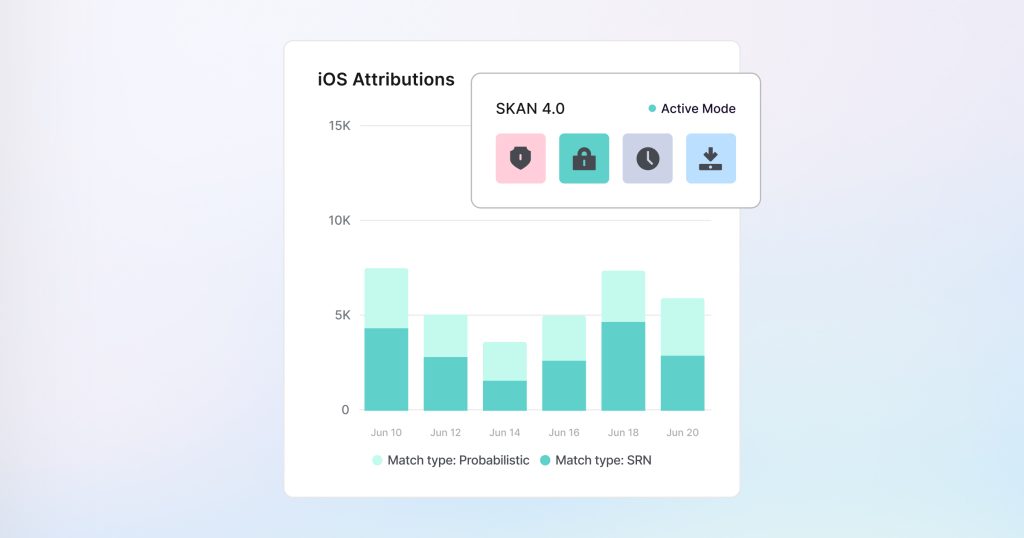
SKAN is Apple’s privacy-safe attribution framework. It provides aggregated, delayed conversion data rather than individual signals. Navigating SKAN 4.0’s conversion value windows and timer logic in practice requires dedicated tooling. An MMP translates SKAN postbacks into usable campaign signals and combines them with probabilistic and deterministic data into one dashboard. In our analysis, AppsFlyer’s Single Source of Truth (SSOT) approach typically reveals a 30 to 60 percent uplift in accurately attributed non-organic installs that would otherwise be misclassified as organic.
Hope Barrett, Sr Director of Product Management at SoundCloud, described the shift: “When I first joined SoundCloud, one of the first issues people mentioned was our messy data. Now, with AppsFlyer, our data is clean. It’s not that we couldn’t analyze it before; we just didn’t have much faith in what we saw. Now, we do.”
Cross-platform attribution
A customer who sees your CTV ad, visits your mobile website, and installs your app appears as three disconnected events in siloed measurement. Cross-platform attribution stitches those events into one journey using a persistent customer identifier, connecting revenue back to the original acquisition source. Without it, you cannot calculate true customer lifetime value (LTV), and upper-funnel channels like CTV get zero credit for the installs they drove.
FuboTV’s Vincent Eterlet, Head of Mobile Growth Marketing: “It’s all about data at the end of the day. There’s no other tool that aggregates and measures the data the way AppsFlyer does.” Using AppsFlyer to expose where different teams’ spending overlapped, FuboTV achieved a 15% drop in effective cost per install (eCPI) and a 20% increase in budget allocation efficiency.
Re-engagement attribution
Attribution is not just about new installs. A lapsed customer who sees a retargeting ad and re-opens your app is a re-engagement conversion that needs its own attribution logic. Without it, retargeting spend is unattributed, re-engaged customers register as organic, and the campaigns driving revenue from your existing base are invisible.
Ad fraud
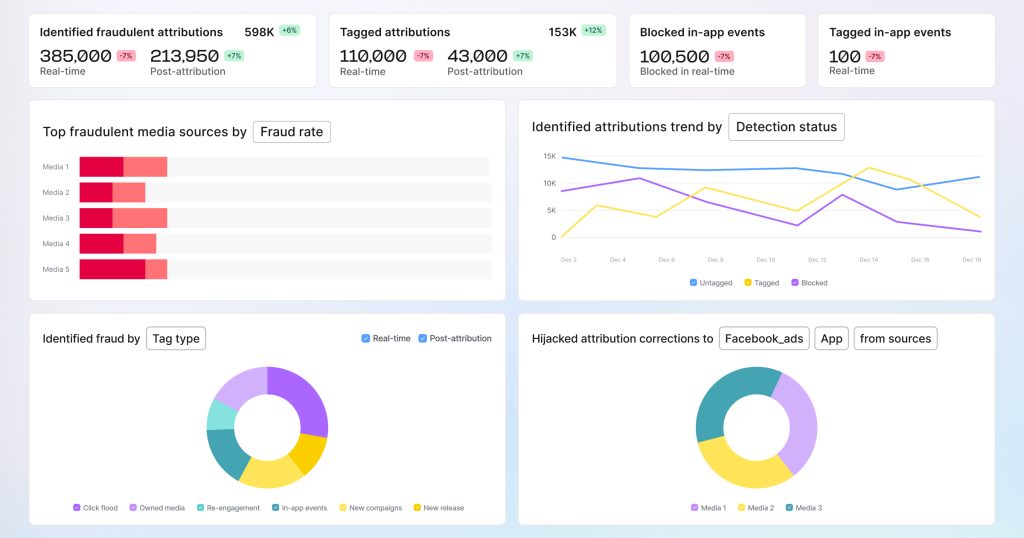
Mobile campaigns are targeted by click flooding, install farms, and SDK spoofing, mechanisms that inflate attributed installs without delivering real customers. An MMP with fraud protection filters these events before they reach your dashboard, so the numbers you are optimizing against represent real people.
How do you choose the right attribution model?
The right model matches your funnel, your data volume, and the decision you are trying to make.
- Choose first-touch or last-touch if you are starting out and need something simple. Both will distort your picture. Last-touch especially undervalues top-of-funnel channels, but imperfect attribution beats none.
- Choose linear or time-decay if you run multi-channel campaigns and want to understand how each touchpoint contributes without building a probabilistic model. Time-decay fits short purchase cycles. Linear fits when you want a baseline view that does not over-weight any single touchpoint.
- Choose position-based (U-shaped) if you run paid acquisition with a clear discovery-to-conversion structure. It acknowledges the first and last touch without discarding the middle.
- Choose data-driven attribution if you have the volume and an MMP to run it. It is the model that reflects how your customers actually behave, not a fixed rule applied over the top.
- Choose incrementality testing alongside any model if you want to answer the harder question: not just which channel got credit, but whether the conversion would have happened without the campaign. Attribution tells you who was credited. Incrementality tells you whether the credit was earned.
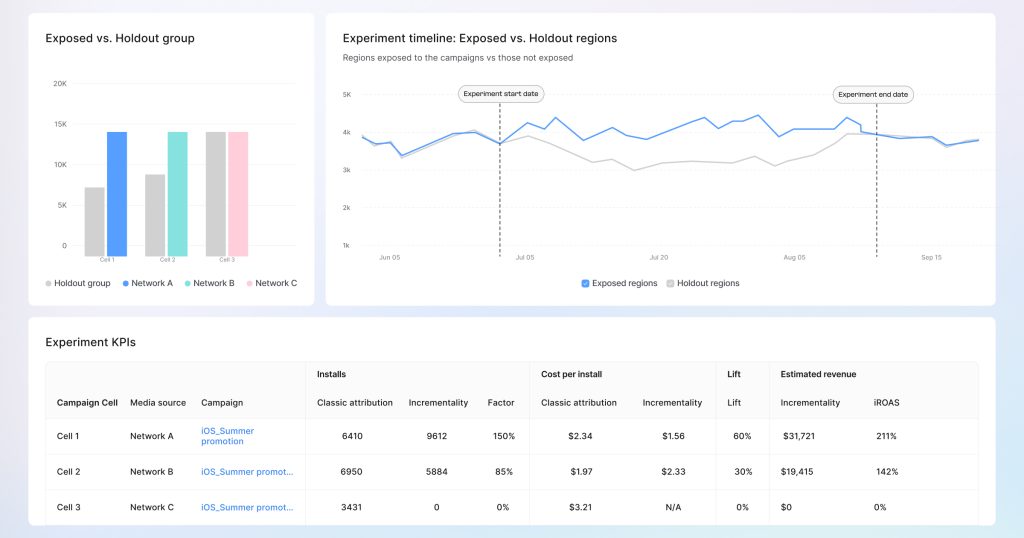
If you run large-scale brand and performance budgets in parallel, consider pairing multi-touch attribution with Marketing Mix Modeling (MMM). MMM uses aggregate data and statistical analysis to measure the broader effect of channels over time, across paid media, seasonality, pricing, and external factors. It is the strategic complement most attribution-mature teams now run alongside MTA in 2026, using MTA for day-to-day channel decisions and MMM for quarterly budget allocation.
Why use AppsFlyer for marketing attribution?
Most attribution tools were built for web funnels. We built AppsFlyer for the channel mix performance marketers actually run in 2026: mobile, web, CTV, retail media, and the AI-driven surfaces that sit outside any other measurement framework, all attributed from a single platform.
Independent measurement across 12,000+ networks
Most marketing teams have sat through a meeting where Meta reports one install number, the BI dashboard shows another, and nobody in the room can explain the gap with any confidence. That’s not a reporting error, it’s structural: each network counts the same customer using its own rules, and nothing forces them to agree. AppsFlyer applies one consistent attribution and deduplication logic across more than 12,000 integrated networks, so each install is credited once, to whichever source actually drove it.
iOS measurement that holds up after ATT
A meaningful share of iOS ROAS reporting right now is simply wrong, and most teams don’t realize which direction the error runs. When customers opt out of device-level measurement, paid installs default to organic, ROAS looks artificially weak, and the campaigns getting cut are often the ones that were actually working. AppsFlyer combines deterministic data, SKAN postbacks, and probabilistic modeling into one view, recovering 30 to 60 percent of non-organic installs that would otherwise be misclassified.
Cross-platform LTV, not just installs
The UA dashboard shows installs and cost per install. The finance report shows revenue. Joining the two by hand, to see whether a Meta install that converted on web six weeks later ever gets traced back to the campaign that earned it, is the kind of task that eats an analyst’s afternoon and still produces an incomplete answer. AppsFlyer stitches the full journey with a Customer Unique ID, so downstream revenue connects back to the original acquisition source automatically.
Fraud that gets caught before it shapes a decision
Click flooding and install farms don’t usually announce themselves, they show up as install spikes that look like a campaign working. By the time the pattern is obvious enough to question, budget has typically already shifted toward it. AppsFlyer’s fraud protection filters this activity out at the point of detection, before it ever reaches a report someone might act on.
Attribution data that feeds directly into automated optimization
Once attribution is clean and unified, it can power agentic AI systems that adjust bids, reallocate budgets, and trigger re-engagement flows without manual intervention. The dependency most teams miss is that this only works in the right direction, an optimization layer is only as reliable as the attribution signals underneath it, garbage in still means garbage out, just automated.
eBay put it plainly: “AppsFlyer is our source of truth when it comes to attribution. We have gained full 360-degree insight into our user acquisition activity, while lowering our costs. No marketing tech stack is complete without AppsFlyer.
Key takeaways
- Marketing attribution connects spend to outcomes. Without it, budget decisions default to whichever channel claims credit most aggressively.
- Attribution models range from first-touch to data-driven. Start simple, validate with incrementality testing, and build toward data-driven as your data matures.
- The model matters less than whether your measurement is independent of the platforms reporting into it. Self-reported data from Meta or Google is not the same as independently attributed data.
- Mobile attribution has structural constraints: ATT, SKAdNetwork, cross-platform identity gaps that web analytics tools cannot address. A mobile MMP is the infrastructure that resolves them.
- Clean attribution data is the prerequisite for AI-driven optimization. Automated bid adjustments and budget reallocation depend on accurate signals.
If you are running campaigns across more than one channel and your attribution is coming from the platforms themselves, you are negotiating with the people being measured. An MMP takes everything in this guide and operationalizes it in one place, from UTM instrumentation to SKAN reconciliation to cross-platform identity stitching. And with AppsFlyer’s agentic AI suite, accurate attribution becomes the input for autonomous campaign optimization.
See how AppsFlyer’s measurement suite works or request a demo to talk through your attribution setup.
Frequently asked questions
Marketing attribution is the process of determining which channels, campaigns, and touchpoints drove a customer to convert: an app install, a purchase, a registration. It gives credit to the interactions that influenced a conversion so teams know which spend is working and which is not.
Marketing analytics measures campaign performance with metrics like impressions, click-through rates, and revenue. Marketing attribution specifically answers which channel or touchpoint drove a conversion. Attribution is a subset of analytics. It connects activity to outcomes rather than just quantifying volume.
The time period after an ad interaction during which a conversion can be credited to that ad. Common defaults are seven days after a click and one day after a view. Set windows that match your actual purchase cycle. Too short misses legitimate conversions; too long credits campaigns that had no influence.
Neither is right for every situation. First-touch overvalues awareness channels and ignores the path to conversion. Last-touch overvalues the final click and systematically undervalues every channel that built toward it. A multi-touch or data-driven model produces more accurate signals when you have the data to support it.
Mobile marketing attribution connects app installs and in-app events back to the ads and channels that drove them. It differs from web attribution because of app store intermediaries, Apple’s ATT privacy framework, SKAdNetwork’s aggregated and delayed reporting, and the identity gaps that occur when the same customer moves between mobile web and an installed app. A mobile measurement partner is the standard infrastructure for navigating these constraints.
We sit between your apps and 12,000+ ad networks as an independent measurement layer. We deduplicate conversion claims across competing networks, reconcile iOS SKAdNetwork data with probabilistic and deterministic signals, stitch cross-platform journeys using a Customer Unique ID, and make the unified dataset available in real time through dashboards, BI integrations, and AI-assisted querying.
There is no universal answer. Data-driven attribution is the most accurate when you have sufficient volume. Position-based attribution is the most practical starting point for most performance teams. The more important question is whether your attribution is measured independently of the platforms reporting into it. Self-reported data from Meta or Google is not the same as independently attributed data, regardless of which model is applied.