
Customer Lifetime Value (LTV): What It Is and How to Measure It


Customer lifetime value (LTV, or CLV) is the total revenue a business can expect to make from a single customer, over the full duration of their relationship with the app or brand. LTV matters more than short-term metrics like CPI, ROAS, or install volumes – it acts as a long-term predictor of your app’s future success.
Yet most teams are still measuring LTV ineffectively, by measuring per device rather than per user. True customer lifetime value follows the user across all touchpoints – web, app, CTV, PC, Console, and AI search.
In this article, we’ll put you on the path to a complete measurement of customer lifetime value. By the end of this post, you’ll understand the mistake you’re making with your LTV measurements, how to overcome them, and unlock the ability to identify your highest-value customers with cross-platform LTV measurement.
TL;DR
- LTV captures the total revenue per user over their entire relationship with your app, making it a stronger north star to build your strategy around then CPI, ROAS or install volume
- Most marketers are measuring LTV wrong, with per-device LTV understating true customer lifetime value by 2-5x
- Cross-platform LTV stitches together web, app, CTV, and more to give you one true LTV per customer, attributed back to the original acquisition campaign
- Four levers can be pulled to drive LTV: retention (a 5% increase can boost profits by up to 95%), purchase frequency, average order value, and acquisition quality – with cross-platform users delivering up to 30% higher LTV than single-channel users
How do you calculate customer lifetime value?
The standard formula for calculating customer LTV is:
LTV = Average Purchase Value × Purchase Frequency × Customer Lifespan
This is often referred to as the customer lifetime value formula, and it’s the starting point for most marketers looking to calculate LTV. To calculate LTV, you multiply the average order value by the average number of transactions per period, and by the average customer retention (how long the average customer stays with your brand).
In practice: if one of your app users has an average in-app spend of $10 per purchase, and they purchase 5 times a year and stay active for 3 years, your LTV for that user is $150 ($10 x 5 x 3).
Growth teams, however, typically use a more precise version that factors in gross margin and the rate of churn:
LTV = Average revenue per user (ARPU) × (1 / Churn Rate)
Or, with margin factored in:
LTV = (ARPU × Gross Margin) / Churn Rate
If your monthly ARPU is $10, your gross margin is 70%, and your monthly churn rate is 5%, your LTV is $140: ($10 × 0.70) / 0.05 = $140.
Customer revenue is a key input in customer lifetime value calculations, and the accuracy of your LTV depends on using reliable user data.
How to know if your LTV is trending in the right direction? Customer acquisition cost (CAC) lets you calculate a useful benchmark of success: your LTV:CAC ratio shows how much you spend to acquire a user, against how much revenue each customer generates. A healthy benchmark of LTV:CAC is 3:1 – below that, and you’ll be struggling to recoup your acquisition costs over the customer lifetime. A high ratio, above 5:1, suggests you’re currently underinvesting in growth.
Customer acquisition costs continue to climb – up 222% over the last 8 years. That makes having a healthy LTV:CAC ratio increasingly critical for marketers.
Note that formula inputs like AOV, purchase frequency, and retention are surface-dependent and will be understated in a siloed setup.
What affects LTV? The key drivers
LTV is the product of four separate drivers, each of which you can influence through your marketing strategy. Factors such as customer satisfaction, purchase behavior, churn rate, and gross margin also directly impact customer lifetime value.
1. Retention and churn rate
The longer a user stays active, the more revenue they generate. Retention and profitability are strongly linked: even a small increase in retention compounds significantly over time: according to research by Bain & Company, a 5% rise in retention can boost profits by as much as 95%.
Ongoing user retention efforts like loyalty programs and proactive support are critical for maximizing LTV. Retention – and reducing churn – is the single biggest driver of customer lifetime value, and one you should prioritize investment into.
2. Purchase frequency and repeat behavior
Users who buy once are worth less than users who buy frequently. Push notifications, personalized re-engagement and loyalty mechanics are all strategies that drive second and third purchases – all impacting LTV. Marketers can encourage users to make repeat purchases and stay engaged with loyalty programs and personalized experiences. Measuring the average purchase frequency helps you understand how often customers buy and what is driving those purchasing decisions.
3. Average order value / ARPU
Higher spend per transaction increases LTV. Upselling and cross-selling can all help to drive ARPU in the right direction. Understanding customer behavior allows you to segment users for tailored, targeted marketing that encourage higher-value purchases.
4. Acquisition quality
The channel, campaign and creative that brought the user affects their long-term value. Ecommerce app users, for example, generate up to 5x more LTV than web-only shoppers, according to Mobiloud. They purchase 33% more often, and spend 30% more per order.
If you segment users based on their acquisition channel, and analyze their user journey, you can identify which sources deliver your highest-value users. Nurturing valuable customers throughout the entire customer lifecycle – from acquisition to retention and beyond – maximizes long-term growth. Keep in mind that omnichannel users are typically the most valuable of all, providing up to 30% higher LTV than single-channel users.
Only around one in four marketers rank customer lifetime value in their top five KPIs, according to research from Gartner: a significant gap given how directly CLTV impacts budget decisions..
Understanding CLV can drive key strategies such as optimizing acquisition costs, segmenting customers, increasing retention, and refining marketing spend. Accurate LTV data is also what enables AI-driven retention and acquisition optimization – the better the inputs, the smarter the system.
Why most LTV measurements are wrong
Despite being one of the most valuable metrics to build your entire mobile marketing strategy around, many marketers are still measuring LTV inefficiently or even inaccurately. In 2026, an incomplete LTV number can be a disaster. Not only do you end up underfunding valuable channels, or wasting budget chasing less-valuable ones, but your AI bidding systems are learning from incomplete data. Your whole budget allocation is getting systematically distorted.
Three signs that your LTV model isn’t giving you the whole truth:
- Paid social campaigns are returning weak mobile-only ROAS
- Purchases from desktop appear organic
- Your highest-LTV users activate across multiple surfaces
Why do LTV measurements end up wrong? Because your measurement model is missing a trick: many marketers still measure LTV per app or per platform – not per user. This can crush LTV calculation. User journeys in 2026 are rarely confined to one device: web, app, CTV and more all play a role. If you’re not measuring on a user level, then that leads marketers to miss the full picture, with siloed data resulting in flawed LTV measurement.
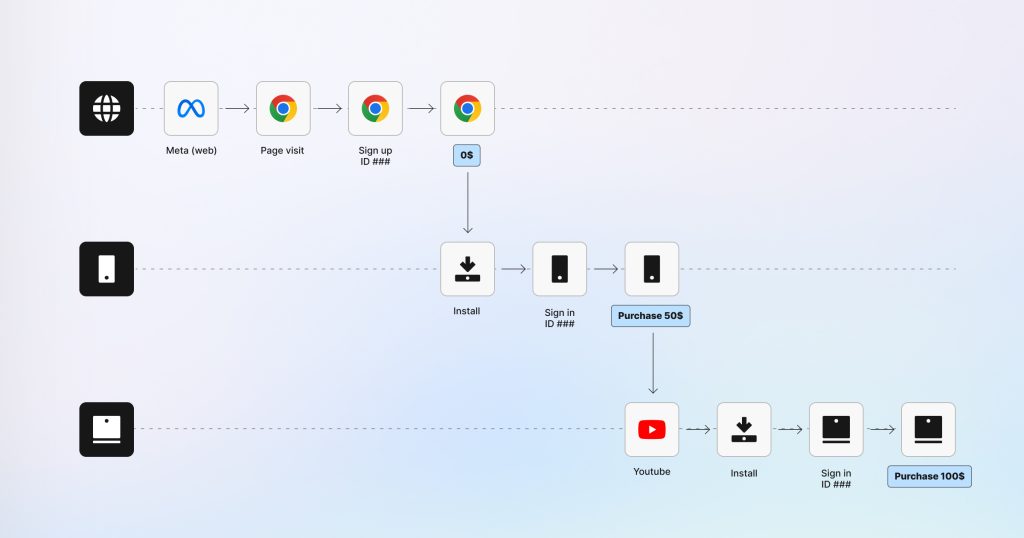
For example: say Meta drives a user to sign up via web, generating $0 of revenue. That user then makes a $50 purchase on iOS, and then an additional purchase on PC of $100. Siloed measurement would record this as Meta generating $0, organic acquisition generating $50, and the PC app generating $100. The true LTV of $150, and crucially, the acquisition source of Meta, would remain invisible.
The consequences of this flawed measurement of LTV can be devastating for your marketing strategy. In an AppsFlyer survey of over a hundred marketers, barely one in three felt that they were able to reliably measure LTV for their apps. Fortunately there is a solution to this measurement gap: cross-platform LTV.
What is cross-platform LTV and how is it different from other LTV calculations?
Cross-platform LTV is the total revenue generated by a single user across all platforms over their lifetime, stitched together under a single Customer User ID and attributed back to the original acquisition campaign. It considers the entire relationship and entire customer lifecycle, capturing all interactions and transactions a user has with your business from initial lead to post-sale support.
Unlike device-level LTV, cross-platform LTV improves marketing decision-making by unlocking:
- Better acquisition decisions by stitching cross-platform journeys together, enabling smarter analysis and stronger ROI insights
- Better attribution by connecting outcomes to the original campaign, so you can invest in the channels and campaigns that bring in your most valuable users
- Better optimization inputs via stitched data, so all stakeholders can make better decisions that drive growth across the full user journey
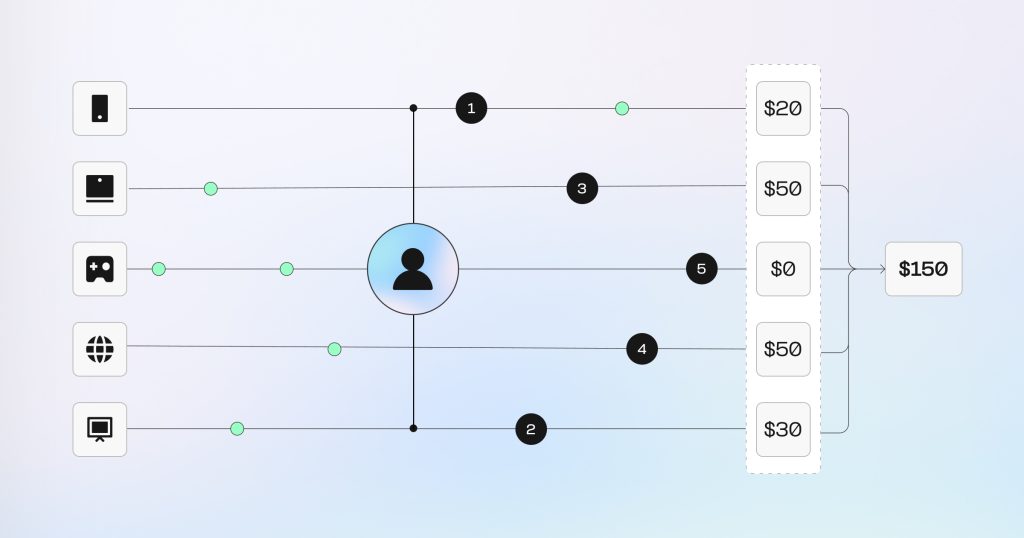
To return to our Meta example above: cross-platform LTV shows this as:
1 Meta campaign → 1 unique user → 3 activated platforms → $150 total cross-platform LTV
This unified LTV number is also what makes AI-powered optimization reliable, allowing you to leverage AI-triggered re-engagement and automated bid calibration. A user acquisition system working from a $30 mobile LTV will underbid for users who generate $150 across all touchpoints, systematically wasting budget.
How to measure cross-platform LTV with AppsFlyer
By stitching together a user’s journey across platforms, you bring it all together into one clear picture and reveal true user-level value. With AppsFlyer’s LTV measurement, you can connect every touchpoint to the campaign that started the journey – encapsulating web, iOS and Android apps, PC, CTV, gaming, or tablet.
When a user installs from a Meta campaign on iOS, browses on web, and purchases on PC, you can connect events and attribute LTV back to the originating campaign with AppsFlyer’s Customer User ID (CUID).
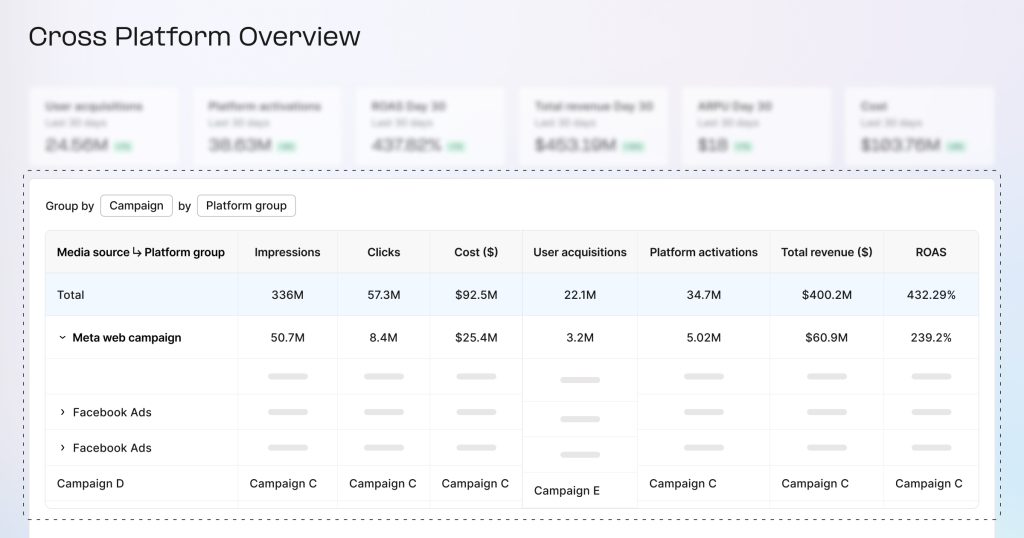
At the campaign level, a Meta mobile campaign that looks like it drove a $30 iOS LTV may actually have driven $150 in cross-platform revenue once web and CTV contributions are stitched in.
Because AppsFlyer measures LTV across all surfaces, this data feeds directly into your automated optimization – enabling UA bidding calibrated to true cross-platform LTV, AI-triggered re-engagement when a user’s predicted LTV drops, and dynamic budget reallocation as LTV signals shift in real time.
LTV benchmarks and what good looks like
Calculating your true LTV is the starting point: your end goal should be to drive that number up. But how to tell if your campaigns are performing to a desirable degree – to see if you have “good” LTV?
A high CLV indicates strong brand loyalty which can predict future financial stability. Understanding future value and average customer lifespan is essential for benchmarking, as these help you estimate future revenue and guide strategic decisions.
Fortunately, there are CLV benchmarks for marketing leaders that you can use. Keep in mind that these are industry-wide, so the actual numbers will vary significantly by category, business model and acquisition channel. We recommend comparing against your own cohort data, but these will give you a solid starting point for your LTV strategy:
- Average eCommerce LTV: $100-300 across most categories. Subscription verticals are usually significantly higher, with beauty subscription users averaging $480-720 LTV and supplements around $680-920.
- LTV:CAC ratio: 3:1 is a healthy benchmark for LTV to customer acquisition cost. Below that and you could struggle to recoup your acquisition costs over the customer lifetime – while a very high ratio (eg, 6:1) suggests you’re retaining users well but underinvesting in growth.
- App vs web LTV gap: app users typically generate 2.8x-5x higher LTV than web-only shoppers.
- Cross-platform premium: omnichannel users show around 30% higher LTV than single-channel users.
- Minimum data required for reliable LTV calculations: 12 months of user data is the typical baseline for a reliable LTV calculation.
You can find more LTV benchmarks, including those for specific verticals, regions, and channels, on the AppsFlyer industry benchmarks hub.
How do you improve customer lifetime value (LTV)?
Getting your LTV to those benchmarks should be one of your main goals as a marketer – and fortunately, there’s plenty of levers you can pull to send lifetime value climbing for your brand. By focussing on targeted customer retention efforts and developing targeted strategies for both acquisition and retention, you can improve customer lifetime value and grow your revenue by engaging users who spend more and with greater regularity.
Improve retention
Improving retention is the single highest-impact LTV lever because of the way that even a small increase in retention compounds to significantly boost profit. The quality of your onboarding and the relevance of the in-app destination that users land on after install are all high-leverage for retention. Retaining existing customers is crucial for maximizing customer lifetime value, as customer retention directly impacts long-term profitability. Seek to retain existing customers through loyalty programs and proactive support.
Drive cross-platform adoption
Users who are active across multiple platforms generate significantly higher LTV, so driving cross-platform adoption should be another area of focus. Invest in app install campaigns, web-to-app conversion, and cross-platform onboarding.
Optimize acquisition by predicted LTV, not CPI
Set your bid strategy and budgets based on the expected cohort LTV, not the cost of install or D7 ROAS. It may be that the channel with a low CPI is also driving your lowest-LTV users. You’ll need accurate cross-platform LTV measurement upstream, but with that in place you can reshape all your acquisition decisions based on who will deliver the greatest lifetime value.
Use LTV:CAC as your north star
Every one of your acquisition channels should be evaluated by the lifetime value of the users it delivers, not just volume or short-term ROAS. For example, a channel with a lower CPI ($15) that drives a $30 LTV is less valuable than a channel with a $40 CPI that drives users with $200.The LTV:CAC ratio ensures you’re focussing on what really matters to lifetime value.
Identify high-LTV segments
When it comes to mobile apps, the Pareto principle applies strongly: 80% of revenue is typically generated by just 20% of users. Find what those 20% have in common: identify the acquisition source, the onboarding path, and their behavior – and build your acquisition strategy around it. For marketers using AppsFlyer, the agentic AI suite automates this layer: predicting LTV by cohort, triggering re-engagement at the right moment, and reallocating spend toward the channels and campaigns generating the highest-LTV users, without requiring manual analysis.
LTV: the right metric to optimize around
Of all your KPIs, LTV is the one to optimize around – but only if it’s measured at the user level, not the device level. Optimizing for customer lifetime value should be a central part of your overall business strategy.
If you’re making acquisition decisions based on per-app LTV, you’re working with an incomplete number. The users generating the most value for your app are typically those who engage across multiple touchpoints – and with cross-platform measurement, you’ll be able to see which campaigns and channels acquired those users in the first place.
Accurate LTV measurement isn’t just a reporting improvement – it’s what allows AI systems to make better decisions about where to acquire, how to retain, and when to re-engage. AppsFlyer’s team can show you how unified LTV data connects to the agentic AI suite in your specific setup. Request a demo →
FAQ
LTV and CLV are often used interchangeably, although some marketers use CLV (customer lifetime value) when looking at an individual customer’s metrics in comparison to LTV (lifetime value) which is used to view average value across the entire customer base.
A good LTV:CAC (customer acquisition cost) ratio is 3:1 – your LTV is 3x your CAC. Below 2:1, you will likely struggle to offset your acquisition costs. A very high ratio, though, suggests that your app has strong retention but is potentially underinvesting in growth.
The standard formula for measuring customer lifetime value for a mobile app is Average Purchase Value x Purchase Frequency x Customer Lifespan = LTV. For example, if one of your app users has an average in-app spend of $10 per purchase, and they buy 5 times a year and stay active for 3 years, the LTV of that user is $150 ($10 x 5 x 3). Marketers may also use a more precise measure of LTV that factors in gross margin and the rate of user churn.
Cross-platform LTV is the total revenue a single user generates across all platforms – mobile, web, PC, CTV – stitched together under one Customer User ID (CUID). By attributing this one true LTV back to the original campaign, you can invest in the channels and campaigns that are bringing the most valuable users. Omnichannel users typically generate 30% higher cross-platform LTV than single-channel users.
A Customer User ID (CUID) is a unique identifier set at login or app launch that connects a single user’s activity across all platforms and devices. With it, you get one true LTV per user, attributable back to the campaign that acquired them.
Twelve months of user data is the typical minimum for a statistically reliable LTV calculation. Early cohort data (D7, D30) can be used to model predicted LTV, but should be treated as directional rather than definitive.
You can measure LTV across web and app in one dashboard with a measurement platform like AppsFlyer, which supports cross-platform attribution with CUID stitching. AppsFlyer’s cross-platform measurement connects user activity across web, iOS, Android, PC, and CTV in a single view, attributing the combined LTV back to the original acquisition campaign. Standard analytics tools that measure each surface separately may understate LTV for users active across multiple platforms.