
Omnichannel Analytics Explained


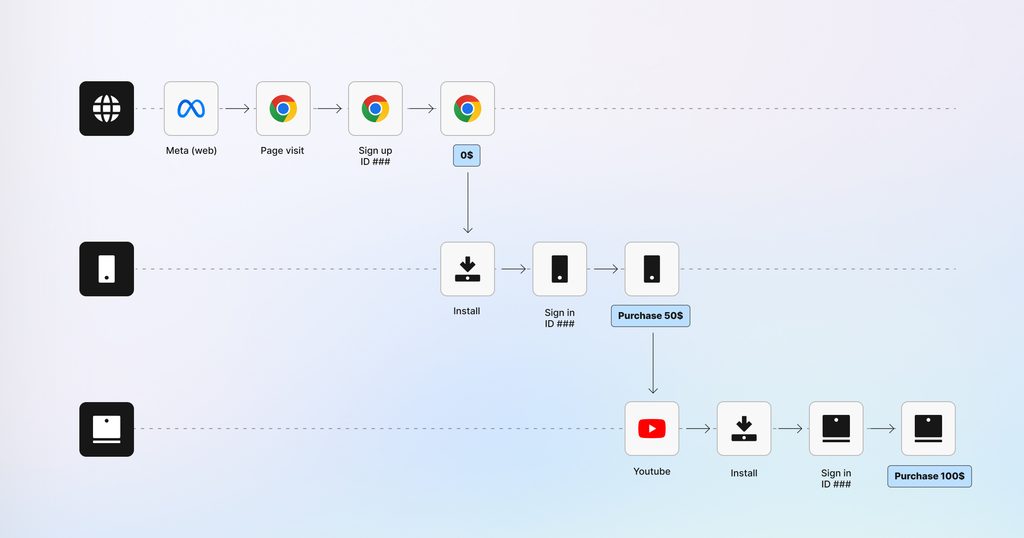
Someone sees your CTV ad on their living room TV, researches on their phone the next morning, and buys on a laptop three days later. Your CTV partner logs a new viewer. Your mobile app logs a new user. Your web analytics tool logs a new session. You’ve just turned one customer into three, and every budget decision downstream is going to treat them that way.
That’s the problem omnichannel analytics exists to solve. Not “which dashboard has the right number,” but “how do I know these three sightings are the same person.” Get that wrong, and nothing you build on top of it, attribution, LTV, retention, holds up. By the end of this article, I’ll walk you through what omnichannel analytics actually is, where it breaks down in practice, and how to set it up: Customer User ID (CUID) setup, deduplication, the whole thing, step by step.
TL;DR
- Omnichannel analytics connects the full customer experience across every digital touchpoint, solving a tangled measurement mess that can arise from a more siloed approach.
- It’s only as good as the data underneath it. Stitching reports together after the fact isn’t the same as true unified measurement, and I’ve seen it lead teams to misallocate budget without realizing it.
- Unified measurement provides omnichannel analytics across mobile (iOS and Android), web, CTV, and LLM/AI search through a single attribution engine.
- When choosing an omnichannel analytics platform, you should take into account surface coverage, privacy compliance, and identity resolutions.
What is omnichannel analytics?
Omnichannel analytics is a form of marketing analytics that gives you unified measurement of customer behavior and campaign performance across every surface: mobile, web, CTV, AI search, and the rest. You’ll also see this called cross-platform measurement, which is the more precise term for the mobile, web, CTV, and console mechanics this guide walks through.
Your users don’t experience your brand in a straight line, and they haven’t for a while. They discover you in one place, research you in another, and convert somewhere else entirely. A single journey moves between mobile, web, PC, connected device, and back again.
But a lot of measurement stacks still treat each of those as separate, which makes it difficult to know which touchpoints are actually driving revenue.
This is what it means to have siloed reporting, where valuable marketing signals slip between the cracks and user journeys get broken. Attribution can go some way to filling the gaps, but not if it’s working with inaccurate or incomplete information.
Omnichannel analytics solves this problem by giving you one lens through which to view your unified customer journey. It’s the difference between disconnected reporting and something you can actually act on.
Something that I see happen all-too often is brands pulling a bunch of channel reports into one dashboard and calling it omnichannel. It’s not. I’ve watched teams do this and then get frustrated that the numbers don’t reconcile. Each channel is still running its own attribution model underneath, and multiple channels claim the same conversions.
What should be a single optimized measurement stack becomes a tangled jungle of dashboards. You can’t compare apples to apples, or then analyze your data through different lenses. The moment you want to define what an event actually means for your business, you’re going to have to put in the work yourself to find the answer.
How is omnichannel analytics different from multichannel analytics?
Multichannel means running campaigns on multiple channels and measuring each one independently. Omnichannel means connecting the full customer experience across those channels into one unified sequence. Here’s what that distinction looks like in practice:
- Multichannel analytics means you’re running campaigns on multiple channels and measuring each one independently. Your dashboard shows a mobile attribution report, a web analytics report, and a CTV report. You can see how each channel performed on its own, but not how they interact.
- Omnichannel analytics means connecting the full customer experience across every digital touchpoint, into one unified sequence.You can understand a user’s behavior from a paid social click to a web visit to an app install, as well as connecting that journey to a transaction. Attribution is applied once, consistently, across the full path. You get one journey, one independent source of truth, and one Return on Ad Spend (ROAS) number.
One more thing to flag, because it does trip people up: “omnichannel analytics” is also sometimes used by customer experience (CX) platforms and customer data platforms (CDPs) to refer to CX measurement or data aggregation. I’m talking about something narrower: measuring ad spend, attribution, and campaign ROI across channels for brands active across multiple touchpoints. CX platforms and CDPs are answering a different question; customer satisfaction and audience activation, not campaign performance.
Multichannel vs omnichannel analytics – compared
Understanding the difference between multichannel and omnichannel analytics will show you the value of an omnichannel approach for calculating cross-platform ROAS, and ensure you don’t fall into the trap of conflicted data.
| Multichannel analytics | Omnichannel analytics | |
|---|---|---|
| Data integration | Separate reports per channel | Unified data layer across surfaces |
| Attribution model | Each channel applies its own attribution model | Single consistent model across all channels |
| Customer journey view | Fragmented: per channel | Connected: full path across all touchpoints |
| Identity resolution | Session or device-level per platform | Cross-device, cross-channel identity stitching |
| Typical output | Channel-level performance dashboards | Unified attribution, incrementality, lifetime value (LTV) |
| Main use case | “How did this channel perform?” | “What drove this conversion?” |
What does omnichannel analytics actually show you?
Omnichannel analytics covers the measurement of four things simultaneously: acquisition, engagement, retention, and revenue. The value is in seeing them connected.
1. Acquisition
Measuring acquisition lets you see where your users come from, by gathering data from paid and organic data sources across every touchpoint. You learn the key acquisition events so that you’re measuring what matters most to your own business.
2. Customer journey engagement
Engagement covers what your users do after they arrive at your app, web page, or connected device. This is where omnichannel analytics tells you something multichannel can’t: not just how many people you’re acquiring, but whether the campaigns driving that acquisition are bringing in people who actually engage.
3. Retention
Retention shows whether customers come back after that first interaction, and whether your cross-channel campaigns are the reason for it. It shows your rates of retention at Days 1, 7, and 30, and how upper-funnel campaigns can affect return frequency, something that wouldn’t get credited in a silo setup.
4. Revenue
This is where it all lands. Omnichannel revenue measurement connects your campaign spend to actual customer transactions and other key metrics like conversion rates and average order value. Unlike siloed multichannel analysis, omnichannel analytics ensures that revenue data follows a customer who moved across multiple touchpoints on the path to conversion.
What are the challenges of omnichannel analytics?
The biggest technical challenge you’ll face is stitching one person’s journey across devices, sessions, and surfaces, while staying privacy-preserving. There are two ways to do this, and I’ve come to understand that you’ll need both:
- Deterministic matching, using known identifiers like authenticated user IDs, email addresses, or phone numbers, to match the same user across touchpoints. Deterministic matching has high accuracy but limited reach, as it only works when users are logged in.
- Probabilistic matching, using device signals, behavioral patterns, and statistical modeling to connect users across touchpoints where deterministic data isn’t available: for example, iOS traffic, anonymous sessions, and CTV audiences where user-level identifiers are unavailable.
A robust omnichannel measurement setup uses both deterministic and probabilistic matching in combination, with privacy-preserving infrastructure underneath. Leaning on just one leaves real gaps in the picture.
What breaks when omnichannel analytics is done wrong?
Two things break most often: last-click attribution gives an incomplete picture of what’s driving conversions, and double-counting inflates performance across platforms. Both show up constantly in customer conversations, and both can quietly wreck a brand’s strategy when data is siloed.
Last-click attribution can give an incomplete picture of what’s driving conversions
If your channels run last-click attribution, lower-funnel channels like paid search or retargeting tend to take credit for conversions that they didn’t actually originate. Someone sees a CTV ad, clicks a mobile push notification, and converts through paid search, and paid search gets full credit, even though the other two touchpoints did the real work of moving them through the funnel.
The channels doing that early work look like they’re underperforming, which leads to budget decisions that underinvest in upper-funnel activity and overvalue the last touch. Unified marketing measurement closes that gap by applying credit that reflects each channel’s actual contribution.
Double-counting inflates performance across platforms
In a siloed setup, each platform has its own attribution logic. Take an example where Meta and Google both claim the same conversion at a customer acquisition cost (CAC) of $10. A glance at their respective dashboards shows green, so you double-down on both. Now your blended CAC is $20, when it should still be $10, because you’re paying for the same user twice. Double-counting creates a false picture of marketing performance. When multiple platforms are claiming the same conversion, your ROAS metrics become unreliable and you increase the risk of overspending.
How does AppsFlyer measure omnichannel analytics?
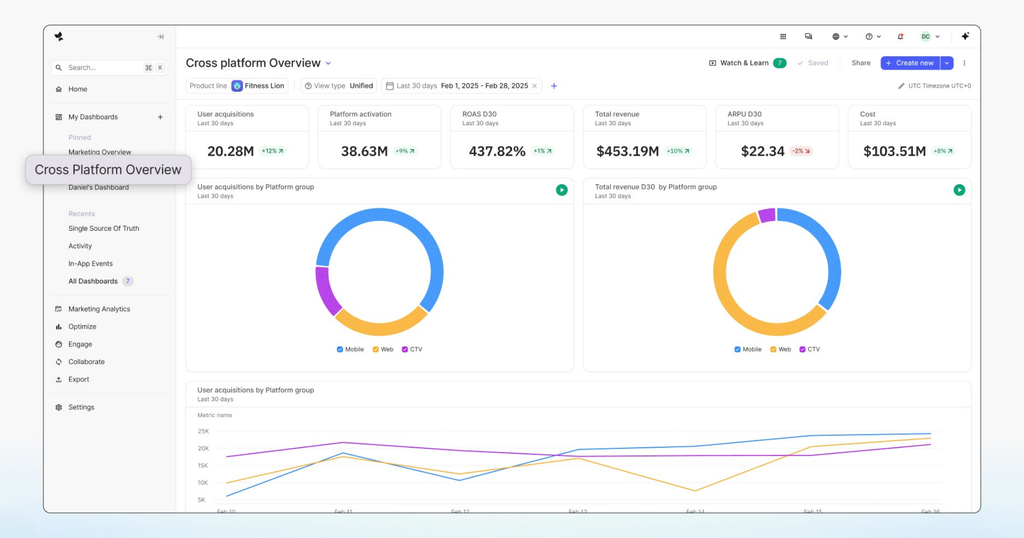
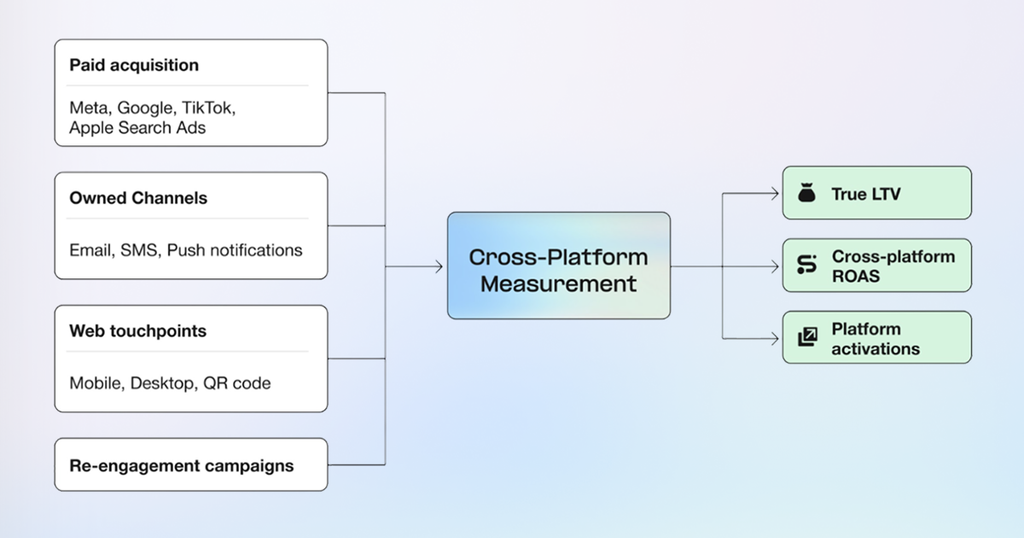
AppsFlyer measures it at the data layer, through three things: a single attribution engine that covers every surface, identity resolution that works without deprecated identifiers, and analytics that run across all channels at once instead of one at a time.
Get that in place and the payoff shows up immediately: a mobile install and a web session from the same person collapse into one identity, ad networks stop getting double credit for a conversion they didn’t originate, and your ROAS number reflects real users instead of duplicated ones.
For the full step-by-step setup, including how to configure each piece and what to watch for at each stage, see our complete guide to cross-platform measurement.
How do you choose the right omnichannel analytics platform?
Check five things: surface coverage, identity resolution, privacy compliance, incrementality support, and how support and migration are handled. Miss one of these, and teams typically pay for it down the line. Make sure you’ve covered off the following areas:
- Surface coverage: does the platform natively support mobile, web, CTV, and AI interfaces, or are some surfaces bolt-ons with separate data models?
- Identity resolution: how does the platform stitch users across devices and sessions? How does the platform handle iOS users where deterministic IDs are unavailable?
- Privacy compliance: does the platform comply with GDPR, CCPA, App Tracking Transparency (ATT), and all other regulatory frameworks without requiring workarounds?
- Incrementality support: can you run incrementality tests across all channels, not just within a single channel?
- Support and migration: what does onboarding look like, how long does it take, and what happens to historical data during a platform transition?
Pinning down answers to every part of this checklist will help you choose the right omnichannel analytics platform for your brand. There isn’t a shortcut through this list: stitching reports together after the fact leaves the problems of siloed attribution and double-counted conversions still intact. The work has to happen at the data layer, before the dashboard even exists.
Why choose AppsFlyer for omnichannel analytics
AppsFlyer’s cross-platform measurement is built for teams running campaigns across channels, and automatically connects touchpoints into one dashboard without the engineering headache. Get that right and it shows up in the numbers: strong omnichannel programs drive a 35% increase in return on ad spend, and a 40% improvement in budget allocation efficiency.
Unified attribution across all surfaces
Most attribution setups break at the point where channels interact. Your campaign may look like it’s working in one report and failing in another, depending on which dashboard you’re looking at.
To see what’s actually happening, open AppsFlyer’s cross-platform measurement report and pull the full customer journey, from first impression to conversion, across mobile, web, and CTV. All touchpoints feed into the same attribution model with consistent lookback windows and fraud filtering.
Agentic AI Suite and Agent Hub
Once cross-platform measurement is up and running, your next challenge is making it usable without rebuilding reports from scratch every time you need to answer a question.
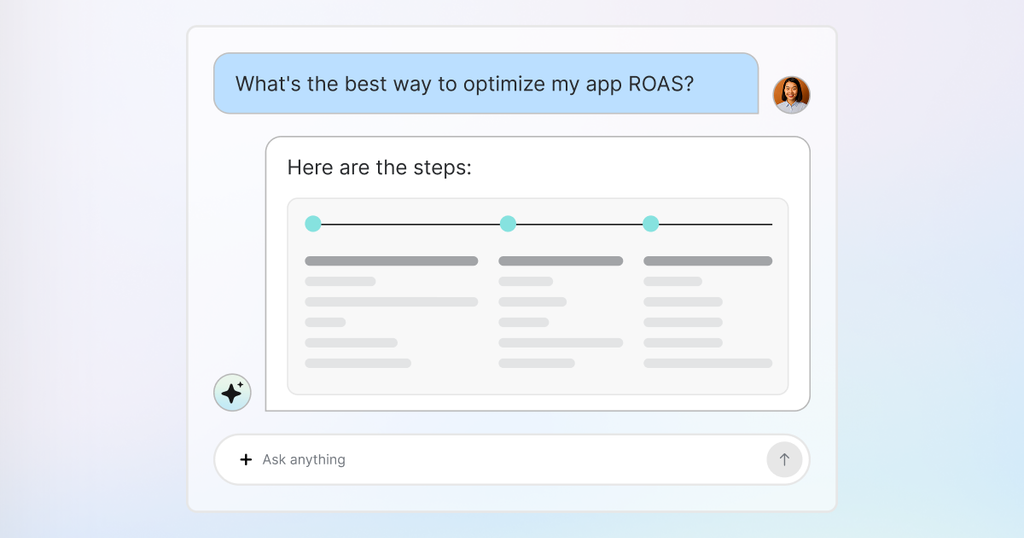
AppsFlyer’s Agentic AI Suite lets you query the connected data layer directly, in natural language. Instead of pulling separate reports for each channel, you can simply ask which channels drove the highest LTV users last quarter? or where is my iOS incrementality weakest? Agentic AI pulls answers from unified data, rather than from one channel’s dashboard.
AppsFlyer’s Agent Hub extends this to automated workflows. When something changes, like a ROAS drop on CTV, or a spike in invalid traffic on a specific network, Agent Hub alerts you without the need for a manual check.
Why does omnichannel analytics start at the data layer?
Because a dashboard can look unified while the data underneath it is still fragmented. If the unification happens after the fact, in a BI tool stitching together five exports, the gaps in the underlying data are still there.The fix has to happen at the layer where the data lives, not the layer where it gets visualized.
Whether you call it omnichannel analytics or cross-platform measurement, the underlying requirement is the same: one identity, one attribution model, one source of truth for every campaign decision that follows. Get that foundation right, and the terminology stops mattering, because your ROAS, your LTV, and your retention numbers are all finally describing the same customer.
For the full technical setup, see our guide to cross-platform measurement. Or talk to our team about what unifying your specific surfaces would look like.
Frequently Asked Questions
Attribution connects your spend to an outcome. Omnichannel analytics is the whole system built on top of that: acquisition, engagement, retention, and revenue, tied together across every surface your customer touches.
Omnichannel analytics measures what your campaigns actually drove. CX analytics measures how people feel about your brand. If you’re trying to optimize ad spend, you need a measurement partner, not a CX platform.
Yes, but you’re trading accuracy for coverage. Aggregated event modeling, probabilistic matching, and marketing mix modeling cover the gaps, iOS traffic, anonymous sessions, wherever a logged-in ID isn’t available. User-level data still gets you the sharpest picture, when you can get it.
It depends on your data maturity and how many surfaces you’re connecting. Identity resolution and historical data migration are what actually take the time. Brands that push through it end up with meaningfully higher LTV than the ones that don’t.
It’s how you prove a mobile user, a web visitor, a CTV household, and an in-store customer are the same person. You need deterministic matching and probabilistic modeling together, because you’ll never get a logged-in ID at every touchpoint. Skip it, and one customer shows up in your data as five different people.