

Cross-platform measurement: the complete guide for 2026


Here is something I see constantly. Three dashboards, three different numbers for the same customer, and a budget decision based on whichever one someone chose to believe that week.
Your mobile app shows an install and a purchase. Your web analytics shows a separate, anonymous session from the same person browsing on desktop days earlier. Your CTV data shows a third, disconnected exposure that never gets tied to either. Three platforms, three fragments of the same customer, no single view.
That is not a data quality problem. Web has never been held to the same measurement standard as mobile, and that gap shows up every time attribution gets reviewed: three systems, three numbers, no single truth.
This guide covers: what cross-platform measurement actually is, why the measurement gap persists even when teams know it exists, and how to connect customer journeys across web, mobile, and CTV into one attributed view that shows what each channel actually contributed to revenue.
TL;DR
- Siloed measurement makes the same customer appear as three different users across three dashboards
- Cross-platform measurement fixes this by following the actual person as they move across devices
- A Customer User ID (CUID) is the identity layer that makes journey stitching possible
- A complete cross-platform framework needs four pieces: a Customer User ID (CUID), Product Line grouping, unified attribution logic, and real-time data access.
- Unifying mobile, web, and CTV data reveals true LTV and ROAS across every surface your customers touch
What is cross-platform measurement?
Cross-platform measurement connects a conversion back to the touchpoints that actually drove it, whether that’s mobile, web, PC, console, and CTV.
It covers every surface a customer moves through, all connected under one identity instead of measured as separate, disconnected devices. We power that identity with a Customer User ID (CUID), a persistent identifier that stitches a person’s activity together across every surface.
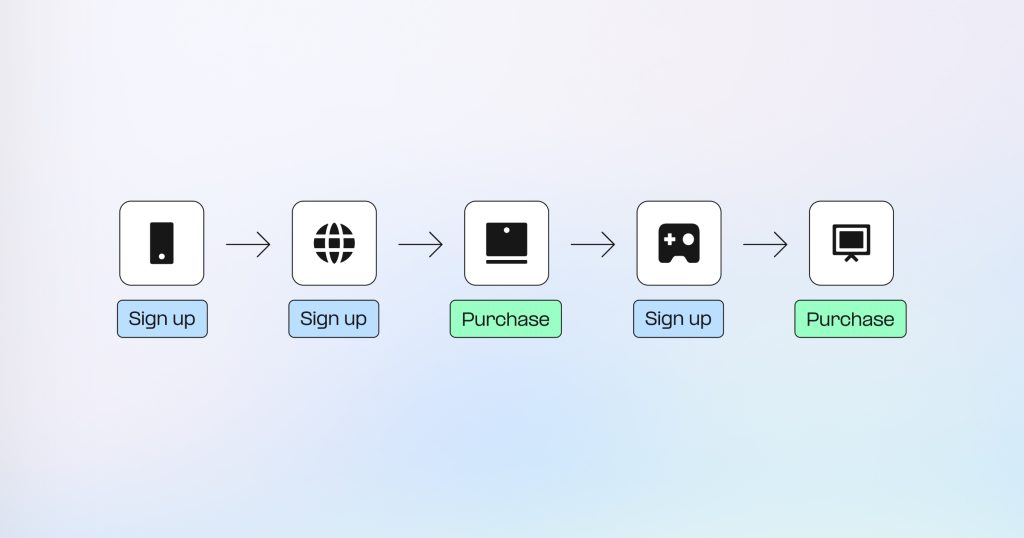
A user’s journey across mobile, desktop, gaming, web, and CTV.
What is the difference between traditional attribution and cross-platform measurement?
Traditional attribution only sees what happens on a single platform or device. It answers a narrow question: what happened on this app, or on this website, in isolation. Cross-platform measurement answers the bigger one: for the first time, which devices and platforms are actually driving revenue and long-term customer value?
A person who signs up on web, purchases on the app, and buys again on PC appears as three separate users in siloed reporting. In practice, this might mean the paid campaign that drove the original web signup gets zero credit, the app purchase looks organic, and the PC revenue is attributed to whatever last-touch channel happened to be in the path.
As a result, you risk scaling the wrong campaigns and underinvesting in the devices and platforms actually driving revenue. With cross-platform measurement, that same person becomes one journey with one LTV figure. The stitching happens automatically, with no manual BI work required.That means the campaign that actually drove them gets full credit, and you can make budget decisions based on the full picture.
Why is cross-platform measurement so hard?
The same question keeps coming up from teams working on this. Most already know their reporting is fragmented. The harder question is what is actually causing it. Three things usually create it.
1) Data is siloed by platform
Web, mobile, CTV, and console each operate as separate reporting environments that were built to measure their own surface, not the full customer journey. Your mobile dashboard shows what happened on mobile. Your web analytics shows what happened on web. Each one is doing exactly what it was designed to do. The gap is that none of them was designed to see across all of them.
2) No neutral referee
Meta, Google, and other platforms self-report, frequently claiming full credit for the same conversion. That is duplicate attribution, and it inflates reported return on ad spend (ROAS) while hiding which campaigns are actually driving high-LTV customers. Each network has an incentive to claim the conversion for itself, and that bias does not fix itself. In my experience, this is where an independent layer matters: AppsFlyer’s attribution layer applies your business logic and deterministic matching to tie a conversion back to its true acquisition source, instead of taking any single network’s word for it. That is what keeps every network’s number honest instead of self-serving.
3) Data stitching is manual
Most teams rely on BI tools and custom pipelines to stitch customer data across platforms and channels, and those pipelines need reworking every time a platform updates an API. In my experience, the teams that have tried to build this themselves either spent a fortune doing it or ended up with something so fragile it broke faster than they could fix it.
This matters even more as AI takes on more of the optimization work. Agentic AI systems can only perform as well as the data they run on. Feed them inaccurate data and you do not just get a single wrong report… you get inaccurate optimization across every campaign, automatically, over time.
What does unified cross-platform measurement look like?
Here is what changes once your Customer User ID (CUID) stitching is active. Every touchpoint tied to the same person, whether it happens on your app, your site, or CTV, gets linked to one persistent identifier. A customer who had three disconnected touchpoints becomes one journey, with one LTV figure, visible immediately, with no BI merging required
Revenue connects back to the original acquisition source, with the option to attribute it to a re-engagement touchpoint as well. And instead of waiting days for BI teams to reconcile reports across incompatible platforms, your team accesses stitched journeys in real time.
The first thing most teams notice is that their reported LTV jumps, not because revenue grew, but because cross-platform purchases that were previously invisible get attributed correctly.
FuboTV had exactly this problem. Customers would see a mobile ad, sign up on the web, and the mobile campaign got zero credit for the subscription. Once we unified their mobile, web, and connected TV data under one customer identity, the team could see which mobile campaigns were actually driving web subscriptions. They reallocated budgets based on the full picture. The result was a 15% reduction in CPI and a 20% increase in budget allocation efficiency, both traceable directly to having one attribution view across channels devices instead of three separate reports.
“There’s no other tool that aggregates and measures the data the way AppsFlyer does. Consolidating, comparing and being creative with the data helped our marketing teams come together to learn and rethink our marketing strategy across all channels and devices.”
Vincent Eterlet, Head of Mobile Growth Marketing at fuboTV
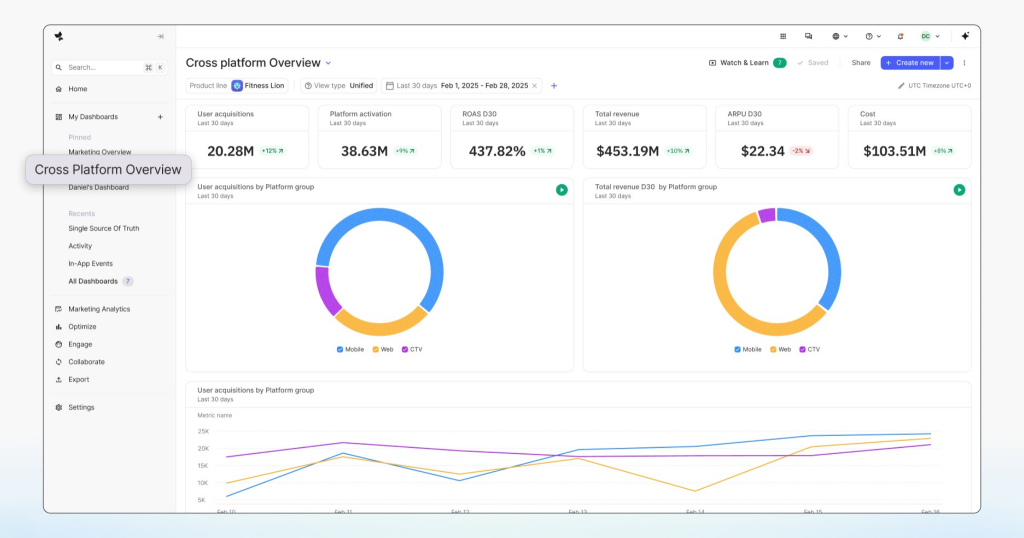
The Cross Platform Overview dashboard, with KPIs and platform breakdowns by Mobile, Web, and CTV.
What are the key components of a cross-platform measurement framework?
This is what a complete framework actually requires. Four components:
- Customer User ID (CUID): A persistent identifier, usually a hashed email or login ID, that stitches customer activity across surfaces
- Product Line grouping: Groups multiple apps and digital assets under one reporting umbrella, so you see the complete customer funnel regardless of which device or surface your customer engaged with
- Unified attribution logic: Applies consistent attribution windows and event definitions across all channels
- Real-time data access: Makes stitched data available in dashboards, BI systems, and AI tools
In my experience, the identity layer is where teams get stuck first. The other three components depend on it. Get all four in place and you have everything you need to see true cross-platform LTV and make budget decisions based on the full picture. The setup section later in this guide walks through each one.
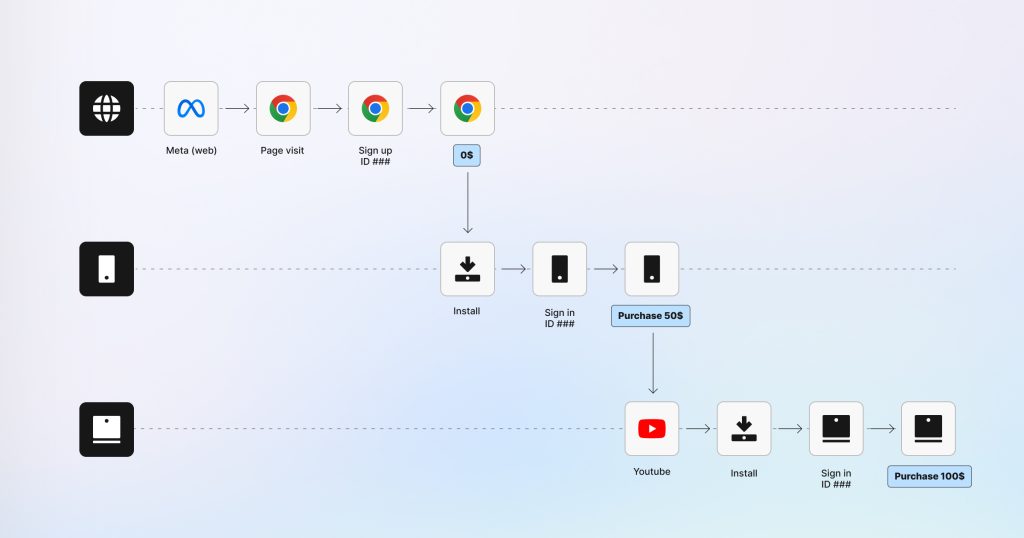
A customer’s journey from Meta web acquisition to iOS and PC purchases, stitched into one LTV via CUID.
How does siloed measurement compare to cross-platform measurement?
The difference between the two approaches shows up across every decision that matters: how a customer is identified, how revenue is attributed, and what ends up in your reporting.
| Feature | Siloed (per-device) | Cross-platform (AppsFlyer) |
|---|---|---|
| Customer identity | Device-level only | Customer-level (CUID) |
| LTV measurement | Per platform, incomplete | True cross-platform LTV |
| Attribution | Last-touch per device | Original acquisition source with the ability to give credit to re-engagement sources as well |
| Platform coverage | Mobile or web, not both | Mobile, web, PC, CTV, console |
| Data stitching | Manual, BI hours | Automated, real time |
| Cross-platform ROAS | Not available | Yes |
| Campaign grouping | Per channel silo | Cross-platform campaign view |
| BI integration | Manual export and merge | Hourly unified dataset |
| Tablet measurement | Undercounted | Unified mobile measurement |
| AI-powered optimization loop | No | Yes, via agentic suite |
Every row where siloed measurement shows a gap is a place where a budget decision is being made on incomplete information. Attribution is crediting the wrong campaign. LTV is missing revenue that happened on another surface. Cross-platform ROAS is not available at all, so you are optimising without knowing what your campaigns are actually returning across every surface. Cross-platform measurement does not change what your campaigns are doing. It just shows you what they were actually doing all along.
Cross-platform measurement in practice: eCommerce, Finance and Gaming
The measurement gap looks different depending on your business. Here is what it typically looks like across three verticals I see most often.
eCommerce
In my experience, the measurement gap looks different depending on your business. These are the three verticals where I see it most.
Something I see constantly in this category: a customer discovers a brand on web, makes their first order on mobile, and ends up doing most of their repeat purchases in-app. In siloed measurement, the web campaign that started the journey gets zero credit for any of those orders. The team looks at the web ROI, sees a poor number, and reallocates budget away from the channel that was actually working.
Sweetgreen had exactly this challenge. Orders were coming in across laptop, phone, and tablet. With separate measurement solutions for web and app, the same customer was registering as different users across both, inflating acquisition counts and undercounting LTV. Once they unified web and app measurement with AppsFlyer, they found that most first-time web customers transitioned to buying primarily in-app. The web campaigns were generating far stronger ROI than the siloed data showed. Sweetgreen reallocated budgets based on the full picture and saw a 17% increase in overall marketing ROI.
“AppsFlyer’s holistic web and app attribution brought the missing data pieces to our revenue and LTV measurement. This allowed us to take better control of our overall marketing strategy and budget.” Jeff Lin, Director of Media and Growth at Sweetgreen
Finance
Finance teams have a measurement problem that most other verticals do not.
The event that actually matters, a deposit, an account activation, a first transaction, does not happen at the point of acquisition. It happens days or weeks later, often on a completely different surface. Which means the campaign that started the entire journey rarely gets the credit it earned.
Sendwave runs campaigns across search, social, influencers, email, push, and referral simultaneously. To grow the way they wanted to, they needed one attributed view across all of it. Not seven separate reports. One picture of which channels were actually driving high-value users and where to invest next.
With AppsFlyer providing that single view, Sendwave could make budget decisions based on the full picture. The result was a 66% reduction in customer acquisition cost and a doubling of their active user base, driven entirely by having one clear picture of what was actually working.
For banks especially, secure server-to-server (S2S) integrations connect these journeys without ever touching sensitive data client-side. A bank can pass downstream events back to AppsFlyer, including account opening confirmed or specific deposit amounts, and use that signal to optimize toward campaigns that drive actual deposit value and long-term customer worth.
The privacy architecture matters here too. S2S postbacks route conversion data without relying on browser pixels or cookies, which is particularly important in a regulated environment.
Gaming
Gaming studios increasingly launch cross-platform titles, but console and PC environments like Steam, Epic Games, Xbox, and PlayStation operate as walled gardens. Tracing a console purchase back to a mobile or CTV ad is genuinely difficult.
Netmarble, one of the world’s largest mobile gaming studios, ran into this exact challenge. Known for titles like Solo Leveling: ARISE, which reached over 50 million global pre-downloads and ranked number one in revenue in more than 30 countries, the company is now expanding beyond mobile into Steam, Epic Games, and PlayStation. As they do, they are building cross-platform measurement with AppsFlyer to connect user journeys across those surfaces, define standard event structures for PC and console funnels, and measure LTV, ROAS, and retention from one unified view rather than platform by platform.
“We look forward to continuing our collaboration with AppsFlyer to further advance cross-platform user analysis. Our ultimate goal is to implement a framework for comparing and defining cross-platform cohort performance for users who play across various platforms.” Seungbok Lee, UA Team Lead, Netmarble
AppsFlyer stitches identity across PC and console specifically built for cross-platform developers, so you get one player view without building the matching logic yourself. Once you pass your internal player ID to AppsFlyer, it matches it to the CUID and connects a customer who sees a mobile ad and converts on Steam, giving you lifetime ROAS across the full franchise.
What are the options for cross-platform measurement?
In my experience, most teams land in one of two places when they decide to solve this.
1. Buy a cross-platform measurement platform
Third-party measurement providers apply a consistent attribution layer across surfaces, handling identity stitching, deduplication, media measurement, and reporting from one independent system.
With AppsFlyer, you get mobile, web, CTV, and console connected for cross-platform measurement in a single solution without requiring a separate identity partner. One system applies a consistent attribution rule, such as first-touch, last-touch, or a custom weighted model, whenever two networks log the same conversion across any surface. The result is one deduplicated attribution record per conversion, tied to the same customer identity across every platform. You also capture web conversions via server-side (S2S) postbacks without a Web SDK, bypassing ad blockers and browser restrictions and typically capturing around 20 percent more conversions than client-side implementation alone.
2. Build it yourself
Some organizations build their own measurement layer using a data warehouse and identity graph. This gives full ownership over identity and attribution logic, but it requires a mature data engineering function and ongoing maintenance as platforms and APIs evolve.
In my experience, the teams that succeed with this approach already operate large internal data infrastructure and have the engineering capacity to maintain it as the landscape changes.
How do the two approaches compare?
Here is how the two approaches stack up across the capabilities that matter most for cross-platform measurement.
Capability comparison
The two approaches look very different when you get into the capabilities that actually matter most for cross-platform measurement.
| Capability | DIY | Basic MMP | AppsFlyer cross-platform |
|---|---|---|---|
| Customer-level attribution | Possible, complex | Device-level | Yes, all surfaces |
| True cross-platform LTV | Manual build | No | Yes |
| CTV coverage | Manual | Limited | Yes |
| Custom key acquisition events | Yes, complex | Limited | Yes, per surface |
| Funnel reporting across surfaces | Manual build | No | Yes |
| Independent of ad networks | Yes | Partial | Yes |
| Server-side (S2S) postbacks | Custom build | No | Yes |
| AI-powered optimization loop | No | No | Yes |
| Setup complexity | High | Low | Low |
| Privacy-ready | Depends | Yes | Yes |
Which approach is right for you?
If you already operate a large internal data infrastructure and need full ownership over how identity and attribution are managed, building your own layer is a legitimate path. For most teams, a platform is the faster route to true cross-platform LTV and ROAS you can actually trust. The attribution logic, deduplication, and reporting are handled in one system. The main engineering investment is getting the CUID implemented consistently across your surfaces, and once that foundation is in place, everything else follows from it without the ongoing maintenance a DIY build requires.
How can you measure across platforms with AppsFlyer?
This is what cross-platform measurement looks like in practice:
Step 1: Implement a Customer User ID (CUID)
Set the CUID every time an app launches or a customer logs in, using a hashed email or login ID as the persistent identifier. This is the most engineering-intensive part of the setup and the effort depends on how consistently your event data is structured today. Everything else in this setup depends on it.
Step 2: Create a Product Line
In the AppsFlyer dashboard, group your iOS app, Android app, web app, and PC or console app under a single Product Line. This automatically shifts your analytics from individual app performance to holistic user behavior across all connected platforms, giving you one funnel view instead of separate reports per surface. Once your apps are grouped, toggle on “Start measuring and analyzing cross-platform” in the Product Line settings. This is the moment your view shifts from individual apps to users across all platforms.

Creating a product line by selecting an app’s Mobile, Web, and CTV versions.
Step 3: Deploy unified SDKs and define shared events
Use the AppsFlyer SDK for mobile and PC apps alongside the Web SDK for desktop and mobile websites. Define custom events, such as account registrations, purchases, or loan applications, under one shared schema so that web and mobile teams are measuring the same things the same way. Consistency in event definitions is what makes cross-surface attribution reliable.
Step 4: Connect ad partners via server-to-server postbacks
Connect ad networks including Meta, Google, TikTok, and Snap through the AppsFlyer Partner Marketplace. AppsFlyer routes real-time cross-platform conversion data directly to these partners via S2S postbacks, allowing their algorithms to optimize without relying on browser pixels that break with ad blockers or browser restrictions.
Step 5: Let AppsFlyer deduplicate across networks
Because multiple networks frequently claim credit for the same conversion, AppsFlyer acts as an independent layer. It deduplicates based on your business logic and configurable lookback windows, so one user equals one attributed conversion across all sources. This is what makes the ROAS number trustworthy rather than inflated.
Step 6: Analyze unified ROAS and LTV in the Cross Platform Overview dashboard
AppsFlyer ingests cost data from 12,000+ integrated partners and maps it against stitched cross-platform revenue. The Cross Platform Overview dashboard shows acquisitions, platform activations across app, web, and CTV, and total revenue in one view. Every purchase, whether it happens on mobile, web, PC, or CTV, connects back to the original campaign that acquired that user, not the last touchpoint before conversion. This means your Meta mobile campaign gets credit for the web subscription it drove three weeks later, and your budget decisions reflect what actually started the journey.
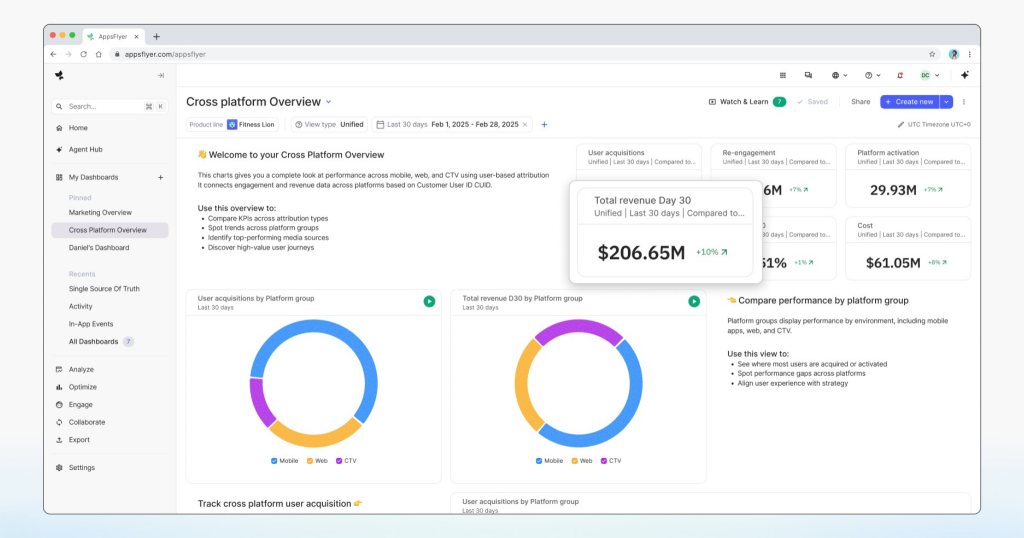
The Cross Platform Overview dashboard, with a tooltip showing Total Revenue Day 30.
For deeper analysis, stream the same user-level data to your BI tools via Data Locker.
Make cross-platform measurement your baseline for 2026
Your customers are already moving across platforms. They are not thinking in terms of mobile session versus web session. They are just using your product wherever it is convenient.
Cross-platform data fragmentation is a solvable problem, not a permanent constraint. It does not require rebuilding your data stack. It requires a consistent identity layer, a unified attribution schema, and a measurement platform that applies both across every surface your customers touch.
As AI agents begin making autonomous budget decisions across surfaces, the teams with unified measurement will have cleaner signals and faster optimization. The question is not whether to close this gap. It is whether you want to be the team that closes it first.
For a full product overview, visit the cross-platform measurement page.
Want to see what this looks like for your specific setup? Talk to our team.
Frequently asked questions
Cross-platform measurement connects customer behavior across every surface a brand operates, including mobile apps on iOS and Android, desktop and web, tablet, PC and console games, Connected TV, and emerging AI-driven environments, into one attributed view.
Cross-device measurement monitors the same customer across multiple devices, like a phone and laptop. Cross-platform measurement goes further by connecting activity across completely different environments, including web, mobile apps, CTV, and console.
Unified marketing measurement applies one consistent attribution model across every channel, platform, and customer touchpoint. Instead of relying on disconnected reports from different systems, marketers get one consistent view of campaign performance, LTV, and media performance.
Cross-platform attribution works by assigning a persistent customer identifier, usually a Customer User ID (CUID), across every platform. When a customer converts on web, app, PC, or CTV, the revenue connects back to the original acquisition source instead of being split across separate reports.
A CUID, or Customer User ID, is a persistent identifier such as a hashed email or login ID. It connects customer activity across platforms, making it possible to stitch web, app, and CTV interactions into one customer journey.
Once CUID stitching is active, every purchase across web, app, PC, and CTV connects back to one customer identity and one acquisition source. This creates one unified LTV figure instead of separate platform-level revenue reports.