
SKAdNetwork conversion value mapping data shows gaps between gaming and non-gaming apps


There’s no doubt that Apple’s iOS 14+ has introduced important measures to safeguard user privacy. But it has also created significant challenges for marketers who have had to adapt to a completely new way of measuring their campaigns.
One of the most complicated areas involves SKAdNetwork’s conversion value and timer extension mechanisms. This is a problem, since post-install data is what matters most in the freemium-driven app ecosystem.
Before iOS 14, marketers could measure in-depth and at length to determine user/campaign value. But in Apple’s SKAdNetwork, data is far less in-depth and at length…You get 64 combinations from 6 bits to map post-install activity and a few days at best of activity data. In other words, conversion values are SKAN’s alternative to [limited] LTV.
With limited options, it’s imperative that advertisers make the most of what is possible. To be clear, what is possible can be plenty if done right. But what does ‘right’ look like? How should marketers map their conversion value schemes?
To answer this question, we looked at data from our Conversion Studio and analyzed the configurations of 900+ apps to help advertisers learn the bits and bytes about the bits and bytes.
The data shows that for many marketers, conversion values are tough to master. While some have learned to squeeze the data lemon (unsurprisingly, mainly from the gaming crowd), others are not even close to utilizing the full potential of this new mechanism.
In this article, we’ll show you how different verticals are:
- Mapping conversion value schemas
- Defining the activity window timer
- Using the 64 combination capacity, or not
For a quick recap on conversion values, watch this video below:
For more SKAN Insights, visit the Inside SKAN series.
What are the types of conversion mappings?
Before we show you the data, here’s a high-level explanation of the different types of models we’ll present in the charts (for more detailed info click here).
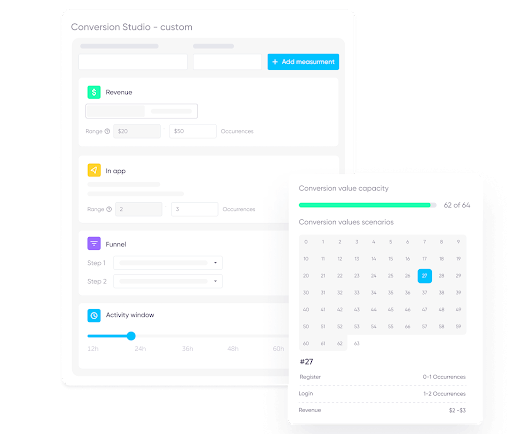
Revenue: Revenue generated by the user during the activity window before the one-time postback is sent. It can be recorded using a single event, or associated with revenue by stream (IAP, IAA, subscription revenue) using select in-app events.
In-App Events: Post-install in-app behavior such as tutorial completions, logins, purchases, shares, and level completions. Marketers can measure the number of unique users performing an event, the number of times an event was performed, or both.
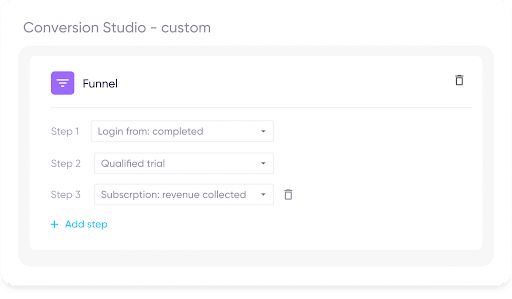
Funnel: Measures the occurrence of in-app events based on a list of sequential events in a funnel. A user performing any event in the funnel is regarded as having performed all the events preceding that event. This is the most efficient way to measure sequential events, using fewer values for the same amount of in-app events measured.
Revenue and in-app events are the most configured schemes
A sub-division looks like this:
Key findings
1. Gaming apps are driven by revenue compared to events-driven non-gaming apps.
The majority of gaming apps are driven by revenue, with 84% of gaming apps utilizing revenue configurations. In contrast, 85% of non-gaming apps measure in-app events.
Why? Gaming apps have a lower time to first purchase – particularly among the highly popular casual games – compared to non-gaming apps. The latter rely on in-app events to be key indicators for purchases that occur beyond the activity window.
2. Almost 40% of Shopping apps use a combination of in-app events and revenue.
As mentioned above, in-app events like registrations and email signups can be key LTV indicators for shopping apps.
No less than 77% of shopping app configurations involve counting events, while 39% use a combination of events and revenue. The primary goal for shopping apps is to drive the first purchase as quickly as possible while measuring key events in the process.
3. 92% of Health & Fitness apps measure in-app events.
Most Health & Fitness apps rely on subscription models, requiring apps to focus on building loyalty and provide consistent value to their users.
With free trials also being common, users take much longer to make a purchase, so it’s imperative that Health & Fitness advertisers focus on measuring early signals of value through in-app events – such as registrations, workouts completed, and shares.
4. 23% of Social Casino apps configured funnel events and revenue.
As one of the highest-grossing app verticals with an excellent ability to identify early patterns of high-value behavioral signals, more than a fifth of social casino apps measure the combination of funnel events and revenue.
5. Hardcore games are laser-focused on revenue.
Hardcore games heavily rely on in-app purchases and not in-app advertising, which is why 93% of these games utilize revenue configurations.
Get the latest marketing news and expert insights delivered to your inbox
Activity window correlates with duration of the funnel
Key findings
1. As the default setting, 24-hour activity windows are the most common.
The majority of apps across all verticals are utilizing the default 24-hour activity windows to collect data, but we expect this to change as SKAdNetwork usage matures.
Beyond the fact that 24h-hour window is the default, it’s important to remember that data can only be collected once, so there is an intentional tradeoff.
Shorter activity windows enable faster data collection, but leave you with limited information. Alternatively, longer windows provide richer data, but access to it will be delayed.
Also, the timer cannot be extended for all users – so even if it’s extended, it will only apply to a portion of users. The only way to extend the timer is by updating the conversion value, which can only happen if the app is opened.
So, even if you set the timer to 72H, if the user didn’t open the app for 24H, the conversion value is locked. For example, if a user opens the app on day 0, day 1, and day 3, the activity of day 3 won’t be recorded – because the app wasn’t opened on day 2.
Lastly, don’t forget that some major ad networks still do not support optimization beyond 24 hours, affecting marketers’ timer decisions.
2. Non-gaming verticals with longer purchase funnels use the 72-hour window.
Finance apps typically have longer purchase cycles, which is why 40% of them are using the maximum 72-hour window.
Similarly, apps in other non-gaming categories use much longer purchase cycles than Gaming apps whose purchase journeys are significantly shorter.
3. 86% of Social Casino games have 24-hour windows.
On the opposite side of Health & Fitness apps, we have Social Casino apps whose ultimate goal is to get players engaged, hooked, and spending as quickly as possible.
guide
Inside SKAN: SKAdNetwork insights
Gaming apps utilize more of the conversion value capacity
Key findings
1. Unlike non-gaming apps, more Gaming apps utilize conversion value capacity.
Gaming app marketers are well known for their level of data-driven expertise and ability to rapidly react to change.
The sheer competitiveness of this vertical dictates that, with 63% already utilizing practically all options, compared to only about 40% of non-gaming apps (Food & Drink apps are an exception with no less than 80% using all options).
2. Hardcore and Midcore games have significantly higher conversion value capacity.
74% of Hardcore and 76% of Midcore games utilize 60-64 conversion values due to their more complex funnels.
Users have a lot more actions and experiences to take at their disposal. They also both utilize longer activity windows, which provide more time to record more events.
How to squeeze the conversion value lemon
While it’s key to learn from industry best practices, your success with conversion goals depends on how you tailor your strategy to your unique app.
Here are a few strategies to keep in mind:
Having 64 options is a limiting factor, but still offers plenty of value if bits are properly allocated and utilized. Make the most of ranges and combinations and focus on the post-install actions that matter most. Split, swap, and combine your conversion mapping configurations until you find the right mix.
Industry best practices are a good place to start. If you don’t have a lot of data to work with, the statistics above are an excellent starting point.
There’s no “right” answer, only what’s best for you. How you implement, measure, and optimize your conversion values is an ongoing process. Test, test, and test again until you find the right mapping (having a UI certainly makes it easier).
Measure smarter with funnels. We’re still in the early days of SKAdNetwork. Therefore, most advertisers are under-utilizing funnel configurations, which can be a more efficient way to allocate your bits.
Instead of dedicating 3 bits to measure three separate events, a funnel configuration can measure sequential behavior using only one bit.
Predictive modeling is not a luxury anymore, it’s a must. The postback timer limits the amount of data you can collect to predict LTV for your users. Leverage predictive modeling to identify the most effective metrics and behaviors that can best identify your most profitable users.
You can employ a predictive benefit score that uses all 6 bits to communicate any score, a specific combination (which will very likely differ from one advertiser to another) will indicate a valuable user cluster.
Remember that while the benefit score is associated with a specific user, once the information comes back from SKAN it’s presented in an aggregate way for a user cluster.
Key takeaways
- Conversion value mapping is one of the biggest challenges app marketers are facing post-iOS 14.5. The right schema can create a significant competitive advantage.
- Despite limited options, conversion values can deliver sufficient insights for measurement if done right.
- There are major differences between Gaming and non-gaming apps due to marketers’ know-how, funnel complexity and length.
- Apps from every vertical are underutilizing funnel usage as adoption of the SKAdNetwork is still in its early days. We expect this to change as marketers get access to more data and adoption matures.
- There’s no right answer on the best conversion models, only what is best for you and your business. However, modeling your conversion mapping after industry best practices is a great place to start.
For more SKAN Insights, visit the Inside SKAN series.