Welcome to the metrics – Everything you need to know about app marketing metrics
By Einav Mor-Samuels
Mobile app marketing, much like the world we live in, thrives on data. Simply put, good data is the key to assessing your apps’ performance, understanding what needs to be improved, and propelling your business forward.
If you’re an app marketer, then mobile app metrics are your key indicators of success: whether it’s acquisition or discovery intel, user engagement rates, or lifetime value and return on ad spend, mobile marketers live and breathe measurement.
That’s why, after publishing your app on the Google Play or App Store, the three questions that will occupy the larger chunk of your brain are:
How do I get more users to download my app (aka user acquisition)?
How do I get users to spend more time in my app (aka stickiness and engagement)?
These are the million-dollar questions, and no single parameter can give you inch-perfect answers. The reality is that most companies are scrambling to drive more quality users to their app, while keeping the ones they already have engaged and active.
With over seven million apps now available across the Apple and Android stores, generating $127 billion in revenue in 2022, competition over users’ hearts and wallets is fiercer than ever before. But don’t lose heart: even minor optimization tweaks could have a tangible impact on your app’s success.
So, to get you well equipped for battle, we’re going to cover 20 of the most vital app metrics that will allow you to measure and improve your acquisition, engagement, retention, conversion, and app performance.
Let’s get started.
What are app metrics and why are marketers so obsessed with them?
App metrics are the window into the performance of your marketing campaigns, keeping you constantly informed on the most pressing trends. They help you understand how well you’re meeting your goals, and where you could make improvements to drive results.
That said, these metrics can’t offer true value in isolation: it’s really their combined forces that will help point you in the right direction and enable you to continuously optimize your app strategy.
App downloads are a great example of the importance of cross-referencing your metrics. While keeping an eye on your number of installs is a good place to start, bear in mind that 1 in every 2 apps is uninstalled within the first month, with “not in use” being the top reason for hitting the “uninstall” button (40%). This is why you must always connect your install metrics to your post-install metrics.
Another important factor to consider before jumping into the metrics is that not all of them might apply to your business. In an insurance app, for example, a high abandonment rate on a registration form is a major red flag that needs to be addressed ASAP. For a gaming app, on the other hand, skipping forms wouldn’t interfere much with the user flow.
To ensure you pursue relevant measurement, it’s paramount to pinpoint which metrics are worth mapping for your business, and which don’t have any real impact on your bottom line .
To make it easier for you to navigate the dense woods of app metrics, we’ve segmented the below into buckets – campaign, app store, install, engagement, revenue, and fraud. Let’s make sense of it all…
Campaign-related metrics
Each campaign is different, which can make it hard to be sure what to measure.
For example, engagement is the goal with a social media campaign, whereas PPC is all about the click. Meanwhile, an SEO strategy revolves around domain authority and rankings.
This is why the campaign metrics you measure should always link back to the campaign goals you’ve set in advance.
Here are two campaign-related metrics you really need to make friends with:
1 – Click through Rate (CTR)
Definition: The share of users who clicked an ad, out of the total number of users who viewed it.
Formula: Number of clicks / Number of ad views
Why does it matter: Although something of a vanity metric (as it doesn’t necessarily lead to conversions), CTR is a good indication that an ad’s creative is performing well by getting viewers interested enough to click.
2 – Click to Install (CTI)
Definition: The share of users who clicked an ad and went on to install your app.
Formula: Number of installs / Number of ad clicks
Why does it matter: Measuring the direct conversion between the two strongest touchpoints on a pre-install user journey, CTI is both socially and technically critical. If people click but don’t install, it could indicate an irrelevant audience, ineffective creatives, a poorly optimized app store page, or slow loading time before an install is complete.
App store-related metrics
Tied into app store optimization (ASO), these metrics allow you to optimize and improve your app’s visibility, in a similar fashion to SEO. Although ASO is a vast world, here’s one important metric you need to keep track of:
3 – App store conversion rate
Definition: The share of users who reached the app store page and went on to install your app.
Formula: Total number of installs / Total number of users on the app store page
Why does it matter: Gauging your app store page performance is a key component of maintaining your ASO. If your page is properly optimized, and shows your users the added value of your app in a clear and attractive way (preferably with video), this will fuel up your app store conversion rates.
Install-related metrics
A key ingredient in every marketer’s cookbook, install-related metrics are your way to ensure your marketing efforts are justifying themselves. Here are a couple of crucial install-related metrics you have to keep a close eye on:
4 – Organic / non-organic split
Definition: The percentage of marketing-driven installs, known as non-organic installs (NOI), out of your total installs.
Formula: Total number of non-organic installs in a defined time frame / Total number of installs during the same time period
Understanding whether your users come from paid or organic activity is vital for your budget. In short — is your marketing actually doing anything, or would those users have found you anyway?
This relates to the concept of “organic uplift”, or the correlation between organic and non-organic installs. If you want to dig deeper, you can investigate non-organic split by channels. This lets you break down non-organic installs into paid and owned media (like SMS, web-to-app conversions, email, and your blog) to understand how you can allocate your budget more efficiently by using more of your own (free) channels.
5 – Share of remarketing conversions
Definition: The percentage of remarketing conversions out of overall marketing conversions (including NOI).
Remarketing is a technique used to re-engage existing users across paid and owned channels. An app’s remarketing conversion (sometimes called retargeting share) is counted when a user clicks on a promotion and opens an app.
Formula:Total number of remarketing conversions / Total number of marketing conversions
Why does it matter: Across most verticals, app marketers are using owned and paid media to re-engage with existing users. Remarketing has become a key strategy that improves retention and in turn user LTV and profitability (it’s much cheaper than user acquisition).
Engagement-related metrics
There are plenty of metrics for analyzing user engagement. However, you don’t really need to measure all of them. The ones you should measure depend on the specifics of your business and the category of your mobile app.
For example, the number of items added to a cart or cart abandonment rates are relevant to eCommerce mobile apps. But for social media apps, it’s much more important to track figures like time per session per user or the number of clicks, comments, shares, and likes.
Here are six engagement-related metrics that every marketer needs to monitor closely, across most lines of business:
6 – Retention rate
Definition: The number of returning users after a given time period.
Formula: Total number of active users who were active over a specific period of time since installation / Total number of users who launched the app for the first time during the selected date range.
Why does it matter:A high retention rate is generally a good indicator of a “sticky” or valuable user experience, as it involves frequent or consistent usage. In other words, retention is the source of monetization; it increases the prospects of in-app purchases and drives higher in-app ad revenue. Generally speaking, average app retention rates tend to be very low across the board, falling to around 6% after 30 days. This is why it’s so important to constantly measure and mitigate it.
7 – Average sessions per user
Definition: The average amount of time users spend on your app in a single visit.
A session begins the moment a visitor arrives at your app and ends when they exit or remain inactive for a predetermined time span. As long as the visitor interacts with your app, the session continues.
Formula: Total number of sessions / Total number of users
Why does it matter: Measuring session lengths and analyzing them based on segments will help you identify high-quality, engaged users, so you know where to focus your campaign efforts.
8 – Uninstall rate
Definition: The rate at which users uninstall your app within a predefined window.
Formula: Total number of uninstalls within a predefined window / Total number of installs during a set time frame
Why does it matter: The rate of uninstalls allows you to compare the quality of the users you acquire from different media sources, campaigns, single ads, or countries.
Across all industries, uninstall rates tend to be extremely high. They’re a strong indication that something might be wrong with your app or onboarding process, or that your promotions didn’t match your users’ expectations.
9 – Funnel conversion rates
Definition: The percentage that identifies the rate at which people are progressing in your app’s funnel.
By mapping key in-app events in your funnel first, the conversion rate can be measured between any two events you define, such as install to purchase, add to cart to purchase, and so on.
Formula: (Total number of desired event conversions / Total number of initial events in the app) x 100
Why does it matter: Funnel conversion rates can quickly illuminate where your marketing and sales processes have fallen out of alignment. Once you establish and measure strong funnel metrics, you can optimize the process with objective insights, such as identifying ideal personas for better campaign positioning, or validating the effectiveness of your marketing efforts.
10 – Paid Conversion Rate (PCR)
Definition: The volume of conversion via paid advertising.
Paid advertising includes PPC, display ads, social media ads (like promoted Tweets or boosted Facebook posts), sponsored posts or reviews, or any other method of marketing that involves a direct exchange of money for mentions or views.
Formula: Total number of conversions / Total number of ad interactions that can be attributed to a conversion during the same time period
For example, if you had 50 conversions from 1,000 interactions, your conversion rate would be 5% (50 ÷ 1,000 = 5%).
Why it matters: PCR is a key element in your paid search strategy. After all, if you’re not actually turning lookers into buyers at a high rate, what are you advertising for?
PCR optimization enables you to maximize every cent of your PPC spend by finding that sweet spot that convinces the maximum percentage of your prospects to take action – and ultimately convert.
11 – Organic Conversion Rate (OCR)
Definition: The volume of conversion via unpaid discovery.
Unpaid discovery includes organic search, word-of-mouth mentions on social media, influencer marketing, public relations mentions and buzz, related apps in the app store listings, or any other way of marketing that doesn’t involve direct paid advertising.
Formula: Total number of conversions – Total number of paid conversions
Why does it matter:60% of marketers say inbound marketing is their best source of leads, and OCR is a great benchmark of success.
Revenue-related metrics
In business, the single most important factor is your bottom line. Here are seven ways you can measure your app’s ability to generate revenue and drive profitability:
12 – Cost Per Install (CPI)
Definition: Focusing on paid installs rather than organic ones, CPI measures the cost an advertiser pays a publisher for driving an install.
Formula: Ad spend / Total number of installs directly tied to ad campaign
Why does it matter: Back in the days when $0.99 apps were the industry standard, CPI was the most frequently used metric for measuring campaign performance. Installs still matter today, butKPIs like cost per action – that better reflect the complexities of free-to-play markets – are gaining ground.
13 – Cost Per Action (CPA)
Definition: The cost of achieving a conversion action.
This doesn’t necessarily imply the conversion comes from a new user, but from a new behavior such as signing up for a subscription, upgrading to a premium account, in-app purchases, or new permissions.
Formula: Cost / Total number of actions being measured
Why it matters:CPA is a pure performance metric that ensures payment is only made when high-quality users are acquired. It’s generally distinguished from customer acquisition cost (CAC) by its granular application. Armed with your average order value (AOV) and lifetime value (LTV – see below), you can set your own criteria for the action you want to measure.
14 – Lifetime Value (LTV)
Definition: The amount of revenue users have generated from the moment they installed your app to date.
Why does it matter: Combined with the average revenue per user, LTV is a golden metric to determine the total prospective revenue or value of your users. In the free-to-install app economy, it’s an essential metric to measure business health.
15 – Average Revenue Per User (ARPU)
Definition: The average amount of cash generated per user via in-app purchases, ad impressions or clicks, subscriptions, paid downloads, or other forms of monetization.
Formula: Revenue during a predefined period of time / Total number of users
Why it matters:ARPU informs you of the quality of your average user in terms of what matters most – generated revenue.
In our industry, ARPU and LTV are often used interchangeably: Day 90 LTV is the same as Day 90 ARPU. The difference lies in the fact that LTV has to be based on an install date, whereas ARPU does not.
If no install date is set in your activity reports, simply look up all revenue generated during time frame X, and divide that number by all active users during the same time frame, regardless of when they installed.
16 – Share of paying users
Definition: The percentage of installers who ended up making an in-app purchase within a given time frame since the initial install.
Formula: Total number of users that made a purchase X time after install / Total number of installs
Why it matters: This metric is a key indication of quality users driven from media sources, as well as a good way to measure the performance of your monetization model.
Despite the fact that only 5% of users spend money on in-app purchases, the revenue these users generate is 20 times greater than the revenue earned from all other paid users combined.
17 – Purchase Frequency (PF)
Definition: The average number of purchases your users made during a specific period of time.
By definition, this metric will also allow you to keep track of users who made zero purchases, and who could be enticed to place orders using targeted campaigns.
Formula: Total number of purchases over a time period / Total number of users during the same time period
Why does it matter: PF is an ideal KPI to measure user loyalty, as well as highlight underperforming products or categories.
It also enables you to identify these users for smarter look-alike marketing and remarketing campaigns. You can reward your highest PF users – -, or, on the flip side, exclude them from your paid remarketing efforts, as they’re already highly engaged.
18 – Return on Ad Spend (ROAS)
Definition: The money spent on marketing divided by the revenue generated by users from the marketing campaign in a given time frame.
For example, a Day 7 ROAS of 50% means that a user generated revenue worth 50% of the money spent to acquire that user. In other words, the 100% mark is the breakeven point.
Formula: User-generated revenue from a specific campaign in given time frame / Total marketing spend
Why does it matter: The ultimate metric of profitability, ROAS is the most important metric for UA managers. By constantly comparing income to ROAS, you can better evaluate the performance of your campaigns and the quality of users they acquire.
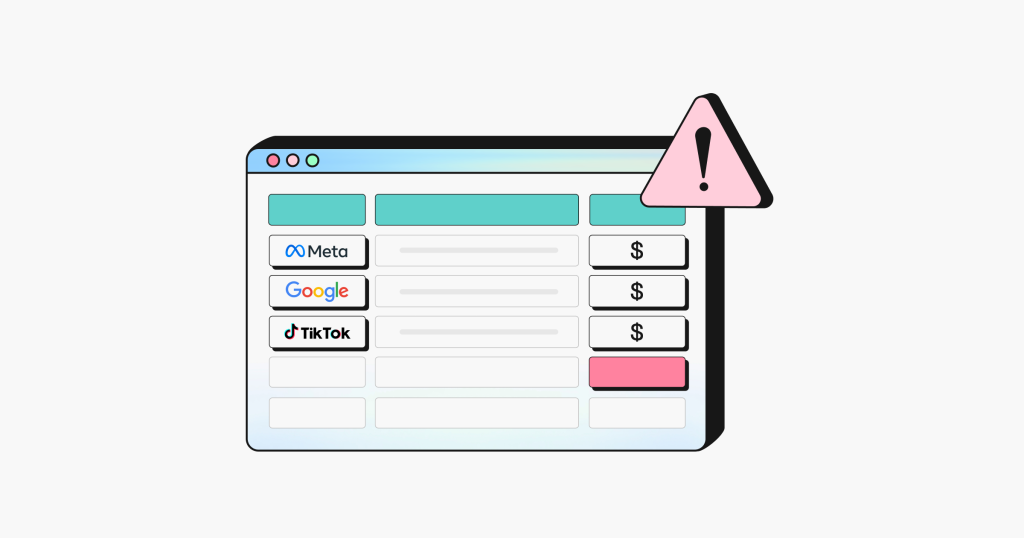
Fraud-related metrics
Mobile fraud is on the rise: in 2022, some 15% of ad impressions on iOS were fraudulent. And that’s not all – there’s a wide range of fraudulent schemes out there, including fake installs, clicks, and in-app events.
Staying ahead of the bad guys is tricky, but essential. Fraud detection solutions use a combination of big data, real-time machine learning and AI, to help marketers identify and flag fraudulent activities such as install hijacking and click flooding.
Here are two important fraud-related metrics you should always pay attention to:
19 – App install fraud rate
Definition: The share of overall identified or blocked fraudulent installs within a certain cohort of app installs. Also called attribution fraud, as its aim is to try and game attribution companies to assign credit to a fraudulent media source.
Formula: Fraudulent installs / Total numberof NOIs (including NOI fraudulent installs)
Why does it matter: With mobile fraud surging more than 40% in the second half of 2022, there’s no getting around it: proactively protecting your app by keeping an eye out for fraudulent activity has never been more important.
20 – In-app fraud rate
The amount of in-app, post-install measurable events that either followed a fraudulent install or were detected as fraudulent, regardless of the associated install’s status.
These events can include measurable, optimization-related events such as CPA with associated payment, as well as in-app purchases.
Formula: Users that made a fraudulent in-app event X time after install / Total number of non-organic users that made an event X time after install.
Why it matters: Fraudsters have recently moved beyond installs to perpetrate fraudulent in-app activity, just as marketers started to move towards CPA. For example, placing bulk orders to a shopping app, then canceling within the allowed window to cash in on high CPA costs.
In fact, we’ve found a ratio increase of 3x between fraudulent installs and fraudulent in-app events, a rise primarily driven by gaming apps.
Honorable mentions
We’ve covered the top 20, but there are still a few other app metrics worth knowing about. For some extra bonus points, consider measuring the following:
1- Cost per click (CPC)
As the name suggests, this is the amount an advertiser pays for every click on their mobile ad.
CPC is a monetization model for advertisers and publishers. The advertiser pays the publisher (who owns the space) every time a user clicks on their particular ad. The click takes the user to the advertiser’s app or website, giving the advertiser an opportunity to acquire a new user or make a sale.
Formula: Total ad spend / Total number of measured clicks
2- Cost per engagement (CPE)
This metric shows the amount an advertiser pays whenever a user takes a specific, desired action within the app.
The “engagement” referred to can be any interaction with the content, such as watching a video, completing a sign-up, or making a purchase. To increase conversions, advertisers often incentivize users to take the desired action, for example by offering in-app rewards or discounts.
Formula: Total ad spend / Total number of desired engagements
3- Cost per mille (CPM)
This is the cost of achieving a thousand ad impressions (“mille” being Latin for thousand).
Think of an impression as a pair of eyes on your content. True, this might always translate into a purchase – but raising your visibility is a good way to build brand awareness. CPM is often used in programmatic advertising, where advertisers buy ad space automatically based on the number of impressions over a set time period.
Formula: (Total ad spend / Number of impressions) x 1000
4 – Effective cost per mille (eCPM)
The revenue generated per 1,000 impressions, eCPM offers a basic approach to evaluating the value of your traffic and determining your CPM.
While CPM is the rate a given advertiser is willing to pay for 1,000 impressions, eCPM is the publisher’s earnings per 1,000 impressions.
Formula: (Total ad revenue / Total impressions) * 1,000
5 – Cost per completed view (CPCV)
Traditional cost per view is the cost of getting your video in front of a user. However, there’s no guarantee they’ll actually watch it all – they could even skip it after the first few seconds. That’s why with CPCV, the advertiser only pays when a user watches their video in full (or up to a set point).
Users who watch a significant portion of a video ad are likely to be more engaged, making them more valuable to the advertiser.
Formula: Total ad spend / Number of completed views
6 – Customer acquisition cost (CAC)
Acquiring customers can be an expensive business: researching your audience, developing creative, and paying for ad space all ads up. But it’s vital to be on top of your numbers here, because if you spend more acquiring customers than they bring in, you’ll end up out of pocket.
CAC shows you the cost of acquiring one customer, so you can compare this against revenue metrics and adjust your spend accordingly.
Formula: Total sales and marketing spend / Number of customers acquired
7 – Daily active users (DAU)
Tracking the number of unique users that engage with your app within a 24-hour window, DAU is typically used by businesses where users are expected to interact with the app on a daily basis (gaming apps, for example).
You’ll first need to decide what you class as “active” – it could be logging in, spending a certain length of time in the app, or performing a particular action.
8 – Monthly active users (MAU)
MAU measures the number of unique users that engage with your app within a 30-day window, making it popular with B2B apps (such as banking) where users are expected to interact a few times a month or less.
As with DAU, you can set the criteria for what makes an “active” user.
9 – The DAU/MAU ratio
This formula allows you to measure the relative volume of monthly active users who engage with your app over multiple 24-hour time periods.
Using the DAU/MAU metric, you can forecast traction and potential revenue over time. But even more importantly, it helps you determine the value of your product by keeping track of how often users return to your app.
Formula: Total number of DAU / Total number of MAU
10 – Churn rate
The exact opposite of retention rate, churn rate is defined as the rate at which your users uninstall your app, cancel, or downgrade subscriptions.
While churn rate is bad in itself, it becomes especially problematic when your most valuable or top revenue-generating users churn, which can have a noticeable, multi-faceted impact on your overall business. Keep an eye on who’s churning and when, to see if you could make improvements.
Formula: Total number of churned users / Total number of users
11 – Repeat purchase rate (RPR)
This metric gives you the number of customers that return to your app in order to make an additional purchase. It can help you with measuring customer loyalty as well as planning your sales strategies.
Repeat purchases drive higher LTV for each acquired or organic customer. The higher the repeat purchase rate, the higher the ROI.
Formula: Total number of purchases from existing users / Total number of purchases
12 – Average order value (AOV)
Primarily important for eCommerce apps, AOV tells you how much your customers usually spend in a single order. It allows you to identify different segments according to spend, or to see which channels are most effective in terms of revenue.
Formula: Total revenue / Total number of number of orders
13– Web-to-app conversion
Did you know, mobile apps typically see conversion rates 157% higher than mobile websites? And in some sectors that figure is much higher. Native apps give a much better user experience, so it’s highly recommended to encourage users to switch from the web to your app.
That’s where this metric comes in: it tracks share of users who start their buying journey on the web and later convert in your app.
Formula: Total number of conversions in app / Total number of users who started on the web and install the app
14 – Average revenue per paying user (ARPPU)
Unlike ARPU, which averages out revenue across all users whether they pay or not, ARPPU is only concerned with the revenue from paying users.
It’s used to evaluate the efficiency of existing in-app purchase (IAP) events, the success of new IAP events introduced to the user flow, and the effect of other events on IAP revenue (such as the option to watch an ad rather than pay). Knowing your ARPPU can help you identify opportunities to upsell and boost revenue.
Formula: Total revenue / Total number of revenue-generating users
15– Return on experience (ROX)
ROX measures the financial impact of experiences on campaigns, making it a more scalable, ongoing derivative of ROI. While it can be tricky to quantify, campaign activity can have a noticeable impact on your user experience — and getting this right will ultimately have a positive effect on your bottom line.
Formula: Benefits (e.g. revenue) / Cost of experience (e.g. software, manpower, services) x 100
Mobile apps, like human beings, thrive on feedback. Simply put, it’s the most efficient way to assess your apps’ performance, understand what needs to be improved, and propel your business forward.
Mobile app metrics are every marketer’s key indicators for discovery intel, user engagement, shares or churn, and is why mobile marketers live and breathe measurement.
There are many, many app metrics out there. But don’t overcomplicate things by trying to monitor too many KPIs that don’t necessarily apply to your business. Experiment to find the best ones for your app, and optimize them to their full potential as you go along.
With every action they take on your app, your users are signaling you what to measure. Watch, listen, and learn, as they’ll show you exactly what to keep track of now, and what to keep track of tomorrow.
FAQs
What are the three key questions app marketers should focus on after publishing an app?
The key questions are: How to get more users to download the app, how to increase user engagement and time spent in the app, and how to improve app monetization through in-app purchases or advertising.
Why is it important to look beyond just app download numbers?
While downloads are important, about 50% of apps are uninstalled within the first month. It’s crucial to connect install metrics with post-install metrics to get a complete picture of app performance.
How can app marketers improve their organic conversion rate (OCR)?
Marketers can improve OCR by focusing on inbound marketing strategies like content marketing, SEO, influencer partnerships, and generating positive word-of-mouth on social media.
What is lifetime value (LTV) and why is it considered a “golden metric”?
LTV is the total revenue generated by users from installation onwards. It’s crucial for determining the overall value of users and measuring business health, especially in the free-to-install app economy.
How can app marketers combat mobile ad fraud?
Marketers should use fraud detection solutions that leverage big data, real-time machine learning, and AI to identify and flag fraudulent activities such as install hijacking, click flooding, and fraudulent in-app events.
We currently offer demos only to businesses evaluating AppsFlyer for their own apps. However, there’s always tomorrow - and we’d be happy to help you build your AppsFlyer expertise to better support your future clients.
To learn more about our Agencies program or for general inquiries, feel free to reach out to us at [email protected].
Are you already an integrated partner with AppsFlyer?
For any question, please sign in to your existing AppsFlyer account and go to Help → Contact our team
We appreciate your interest in becoming an AppsFlyer partner. In order to begin the integration process, you must be referred by an existing AppsFlyer customer via our platform. If you'd like to start the process, please reach out to your customer and kindly request to receive an invite link. You can find additional resources in our Help Center.
This site is protected by reCAPTCHA and the Google Privacy Policy and Terms of Service apply.
3/3
Meet your AppsFlyer expert
Based on your needs, we've matched you with the right AppsFlyer expert. Book a 15-minute discovery call to discuss your goals and schedule your personalized demo
Thanks for reaching out! 🎉
We can't wait to show you around and learn more about your goals and challenges.
In the meantime, here are two great ways to learn more about AppsFlyer: