
Conversion Studio: Fine-tune SKAN post-install measurement with the ultimate conversion value mapping tool
Mastering SKAdNetwork and conversion values is a nightmare. There, we’ve said what everyone is already thinking. When SKAN was (re-)introduced last summer, an entire industry was forced to “relearn” a new type of attribution model. In order to master it, intense, in-depth knowledge of the technical aspects became an absolute must. We’ve invested much of the last 15 months educating ourselves, our customers and the market about SKAN: creating videos, hosting weekly webinars, publishing data studies and blog posts.
We’ve focused a lot of our attention on helping advertisers learn the bits and bytes about the bits and bytes.
To complicate things further, SKAN, by design, limits advertisers’ abilities to measure post-install activity. We’ve worked closely with hundreds of our most advanced advertisers across different industries to understand how they’re planning to utilize conversion values and what sort of capabilities they are currently missing. One thing was clear – mastering conversion values has been challenging for even the savviest of advertisers. So, it comes as no surprise that our #1 feature request has been a flexible conversion value mapping tool.
We want to make this less of a nightmare. For you, for us, and for the entire ecosystem. We’re making it super simple and super flexible for you. It’s not about mastering the bits and bytes, it’s about getting s*** done. Advertisers need to have visibility and control over post-install measurement, and they need to waste less time doing it.
Introducing: Conversion Studio.
Today, we’re beyond excited to unveil Conversion Studio: a flexible, first-of-its-kind conversion value mapping tool. Conversion Studio enables advertisers to easily maximize LTV measurement for post-install activity in the limited capacity of the SKAN framework.
It’s about measuring everything.
Until now, conversion value mapping solutions have limited advertisers to dedicating their entire conversion value to a single metric (tech talk: the flat model, or using all 6-bits for one measurement KPI). Advertisers who wanted to measure more than one aspect of post-install activity (split their bits for measuring more than one metric) had to code conversion value maps themselves through a complicated set of rules, and update their app every time a change was made.
Today, all of that changes:
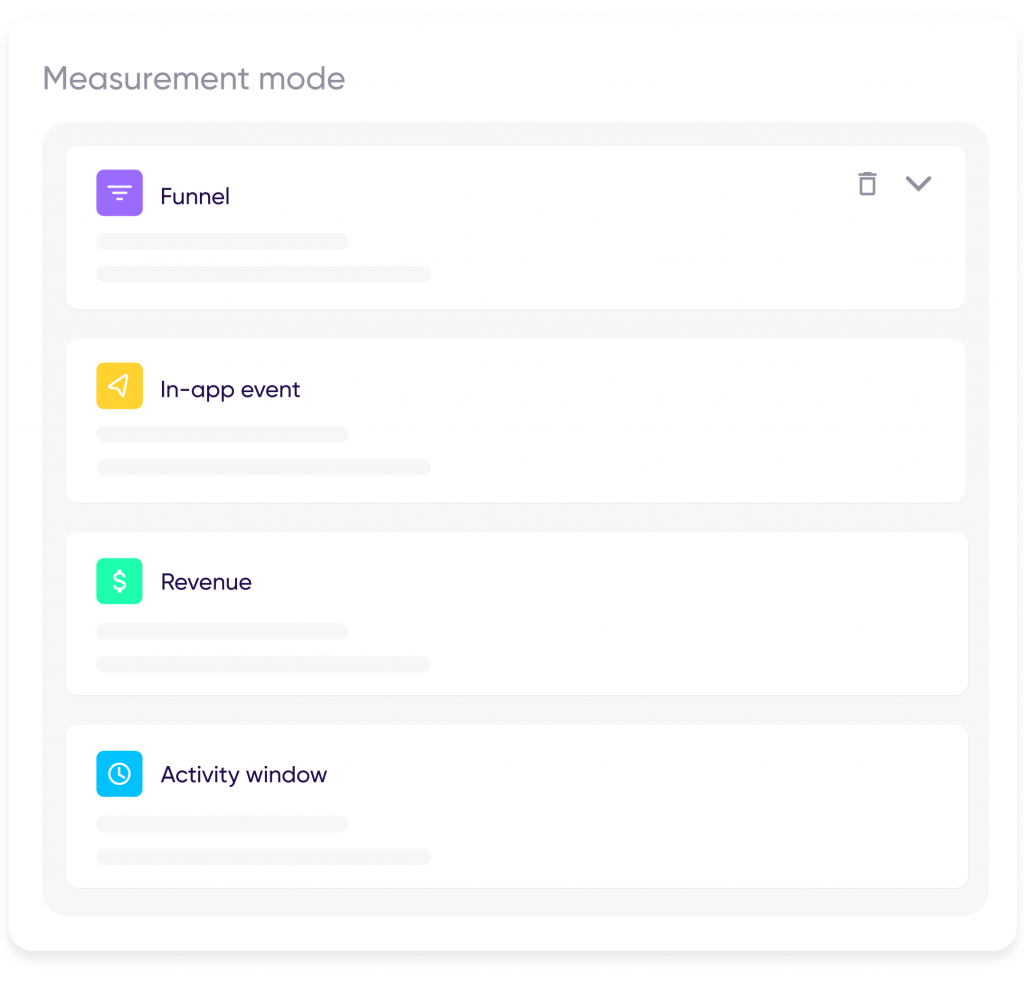
1. Split metrics
No need to tie yourself down to one metric anymore. You can now simultaneously measure metrics such as revenue, in-app engagement, retention and more; customize your own map easily and measure everything you need to.
Gaming app example
A gaming app wants to measure game progress, in-app revenue and ad revenue. Gaming marketers can now measure all three, as well as whatever other metrics they wish to.
2. Extend the timer
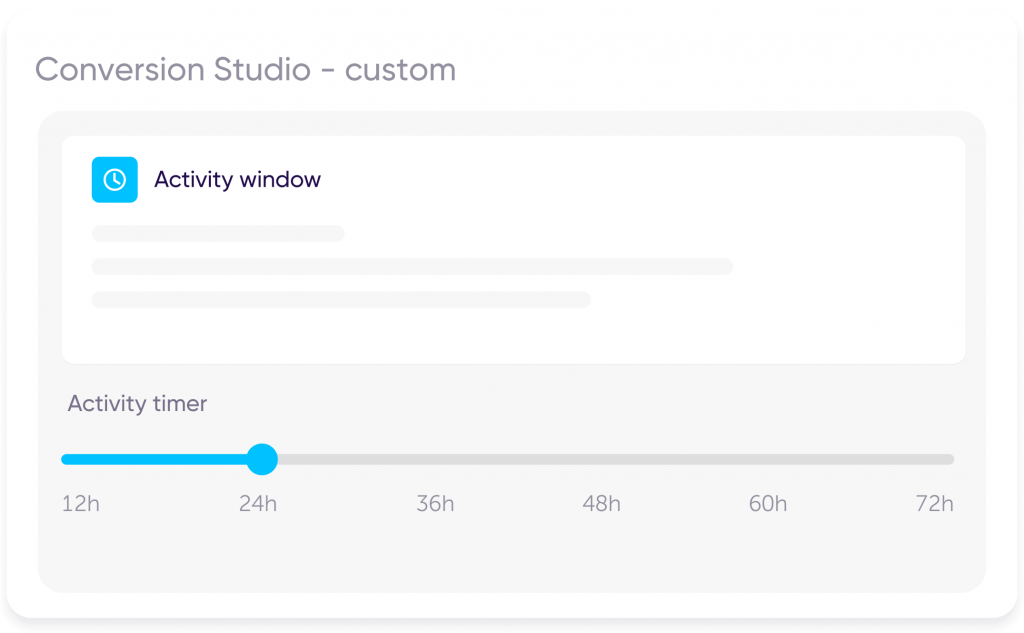
We’ve also added the capability to measure beyond the given 24h activity window.
With Conversion Studio you can now determine the appropriate activity window for your user base, and extend the window to measure critical aspects like retention and cohorts without losing data granularity. The activity timer is divided into 12/24 hour intervals and can be extended up to 72 hours, so that you can get a better idea of when the user was last active.
3. Measure flexible ranges
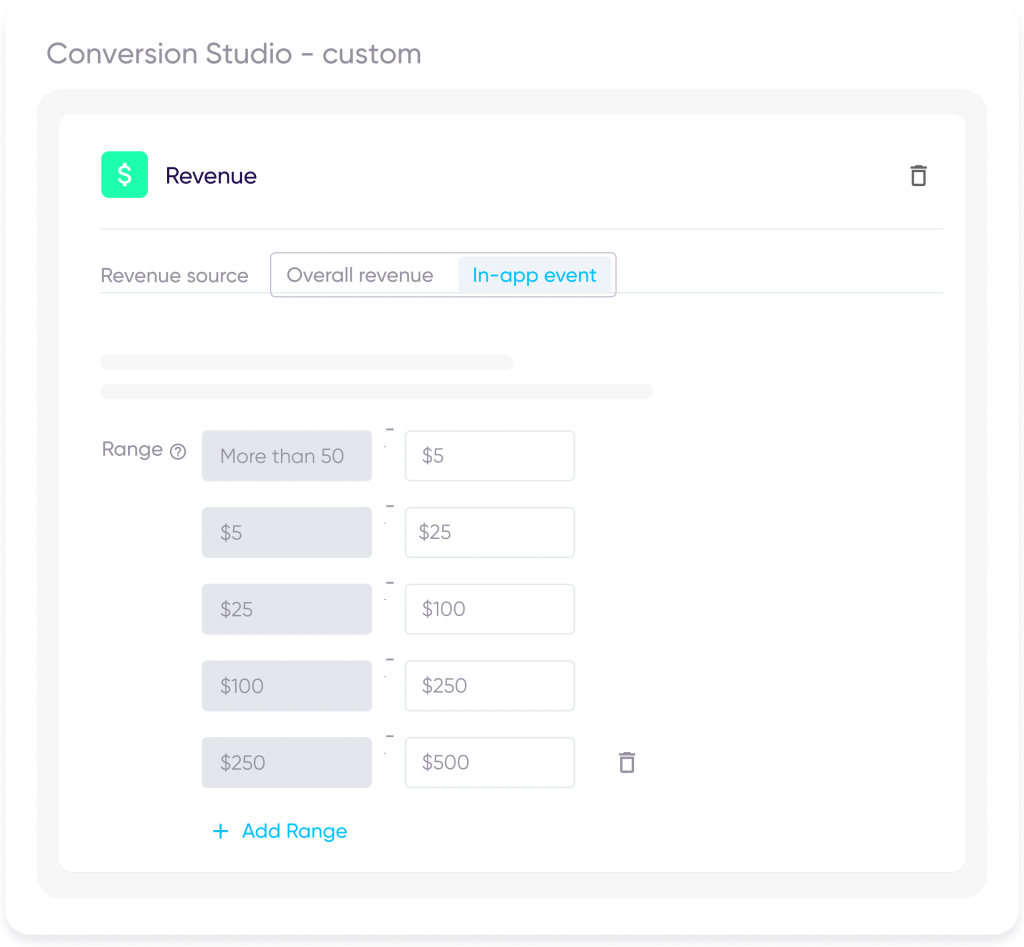
Previous limitations also included strict restrictions in regards to how your conversion value was designed, with each value representing a single unit ($1, one level, etc). Conversion Studio lets you define flexible ranges within a specific metric.
Shopping app example
In the past, whenever you wanted to measure ranges of revenue, you were limited to a range with fixed increments (e.g $0-1, $1-2, $2-3, $3-4 with fixed increments of 1 dollar): Defining flexible ranges enables you to measure revenue tiers that work for your business (all the way up to $1B, if you want!), and capture a broader picture of how users are spending money.
4. Measure funnels
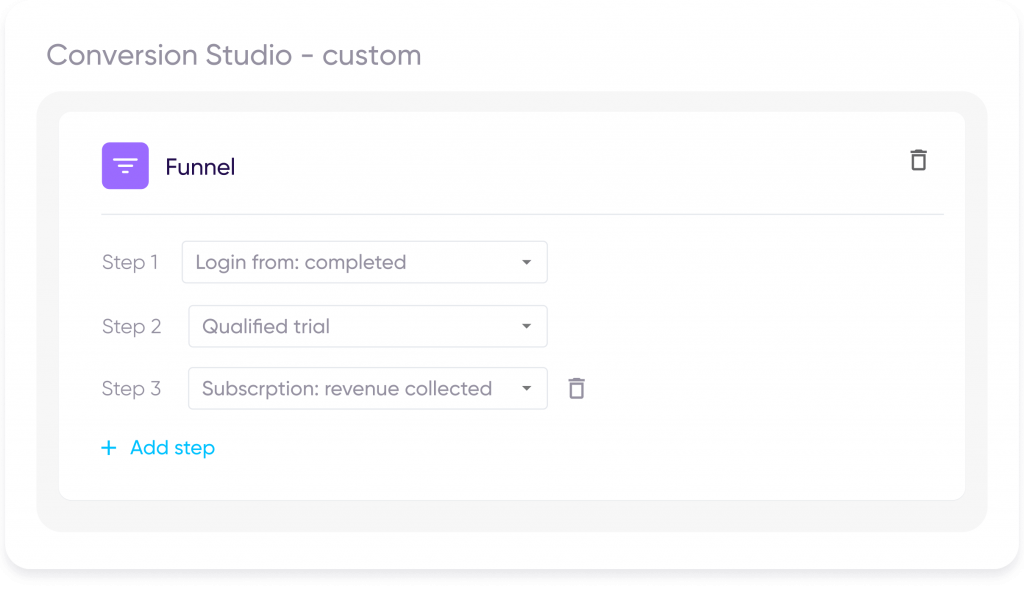
It’s not just about measuring more, it’s about measuring smarter. You can now measure a sequence of events to get the bigger picture on how users are behaving in your app. This is the most efficient way to measure sequential events, using fewer values for the same amount of in-app events measured. By choosing the funnel function in Conversion Studio, you can set up the order of in-app events you’d like to measure, to see how many users completed part or all of the funnel.
Subscription model example
Measure subscription by selecting these three events in order: login_form: completed, qualified_trial, subscription: revenue_collected.
It’s also about keeping it simple.
We talked a lot about bits: how many they are, how they work, how to map them. We’ve spent countless hours educating our teams and our customers on how to grapple with this concept as the only means to truly measure LTV for SKAN campaigns.
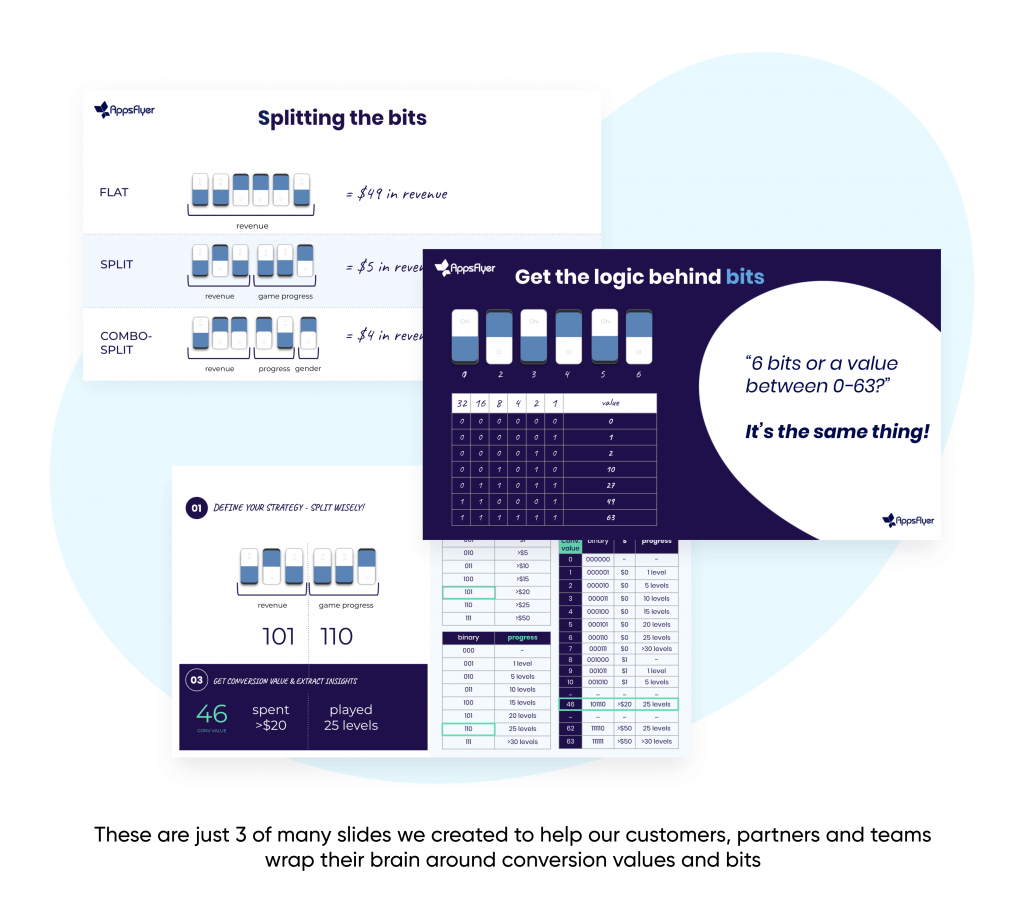
We’ve decided to remove the hassle of managing bits altogether. Conversion Studio lets you focus on what you want to measure (retention, cohort, revenue, funnel progress and more) while leaving the technical aspects to us. You take care of the vroom vroom, we take care of what goes on under the hood: allocating the bits and the conversion values in the most optimal way based on what you want to measure.
We’ve added visual cues that show your conversion value capacity and how your bits are allocated, so you can easily fine-tune your mapping to make sure you’re making the most of your available 64 values.
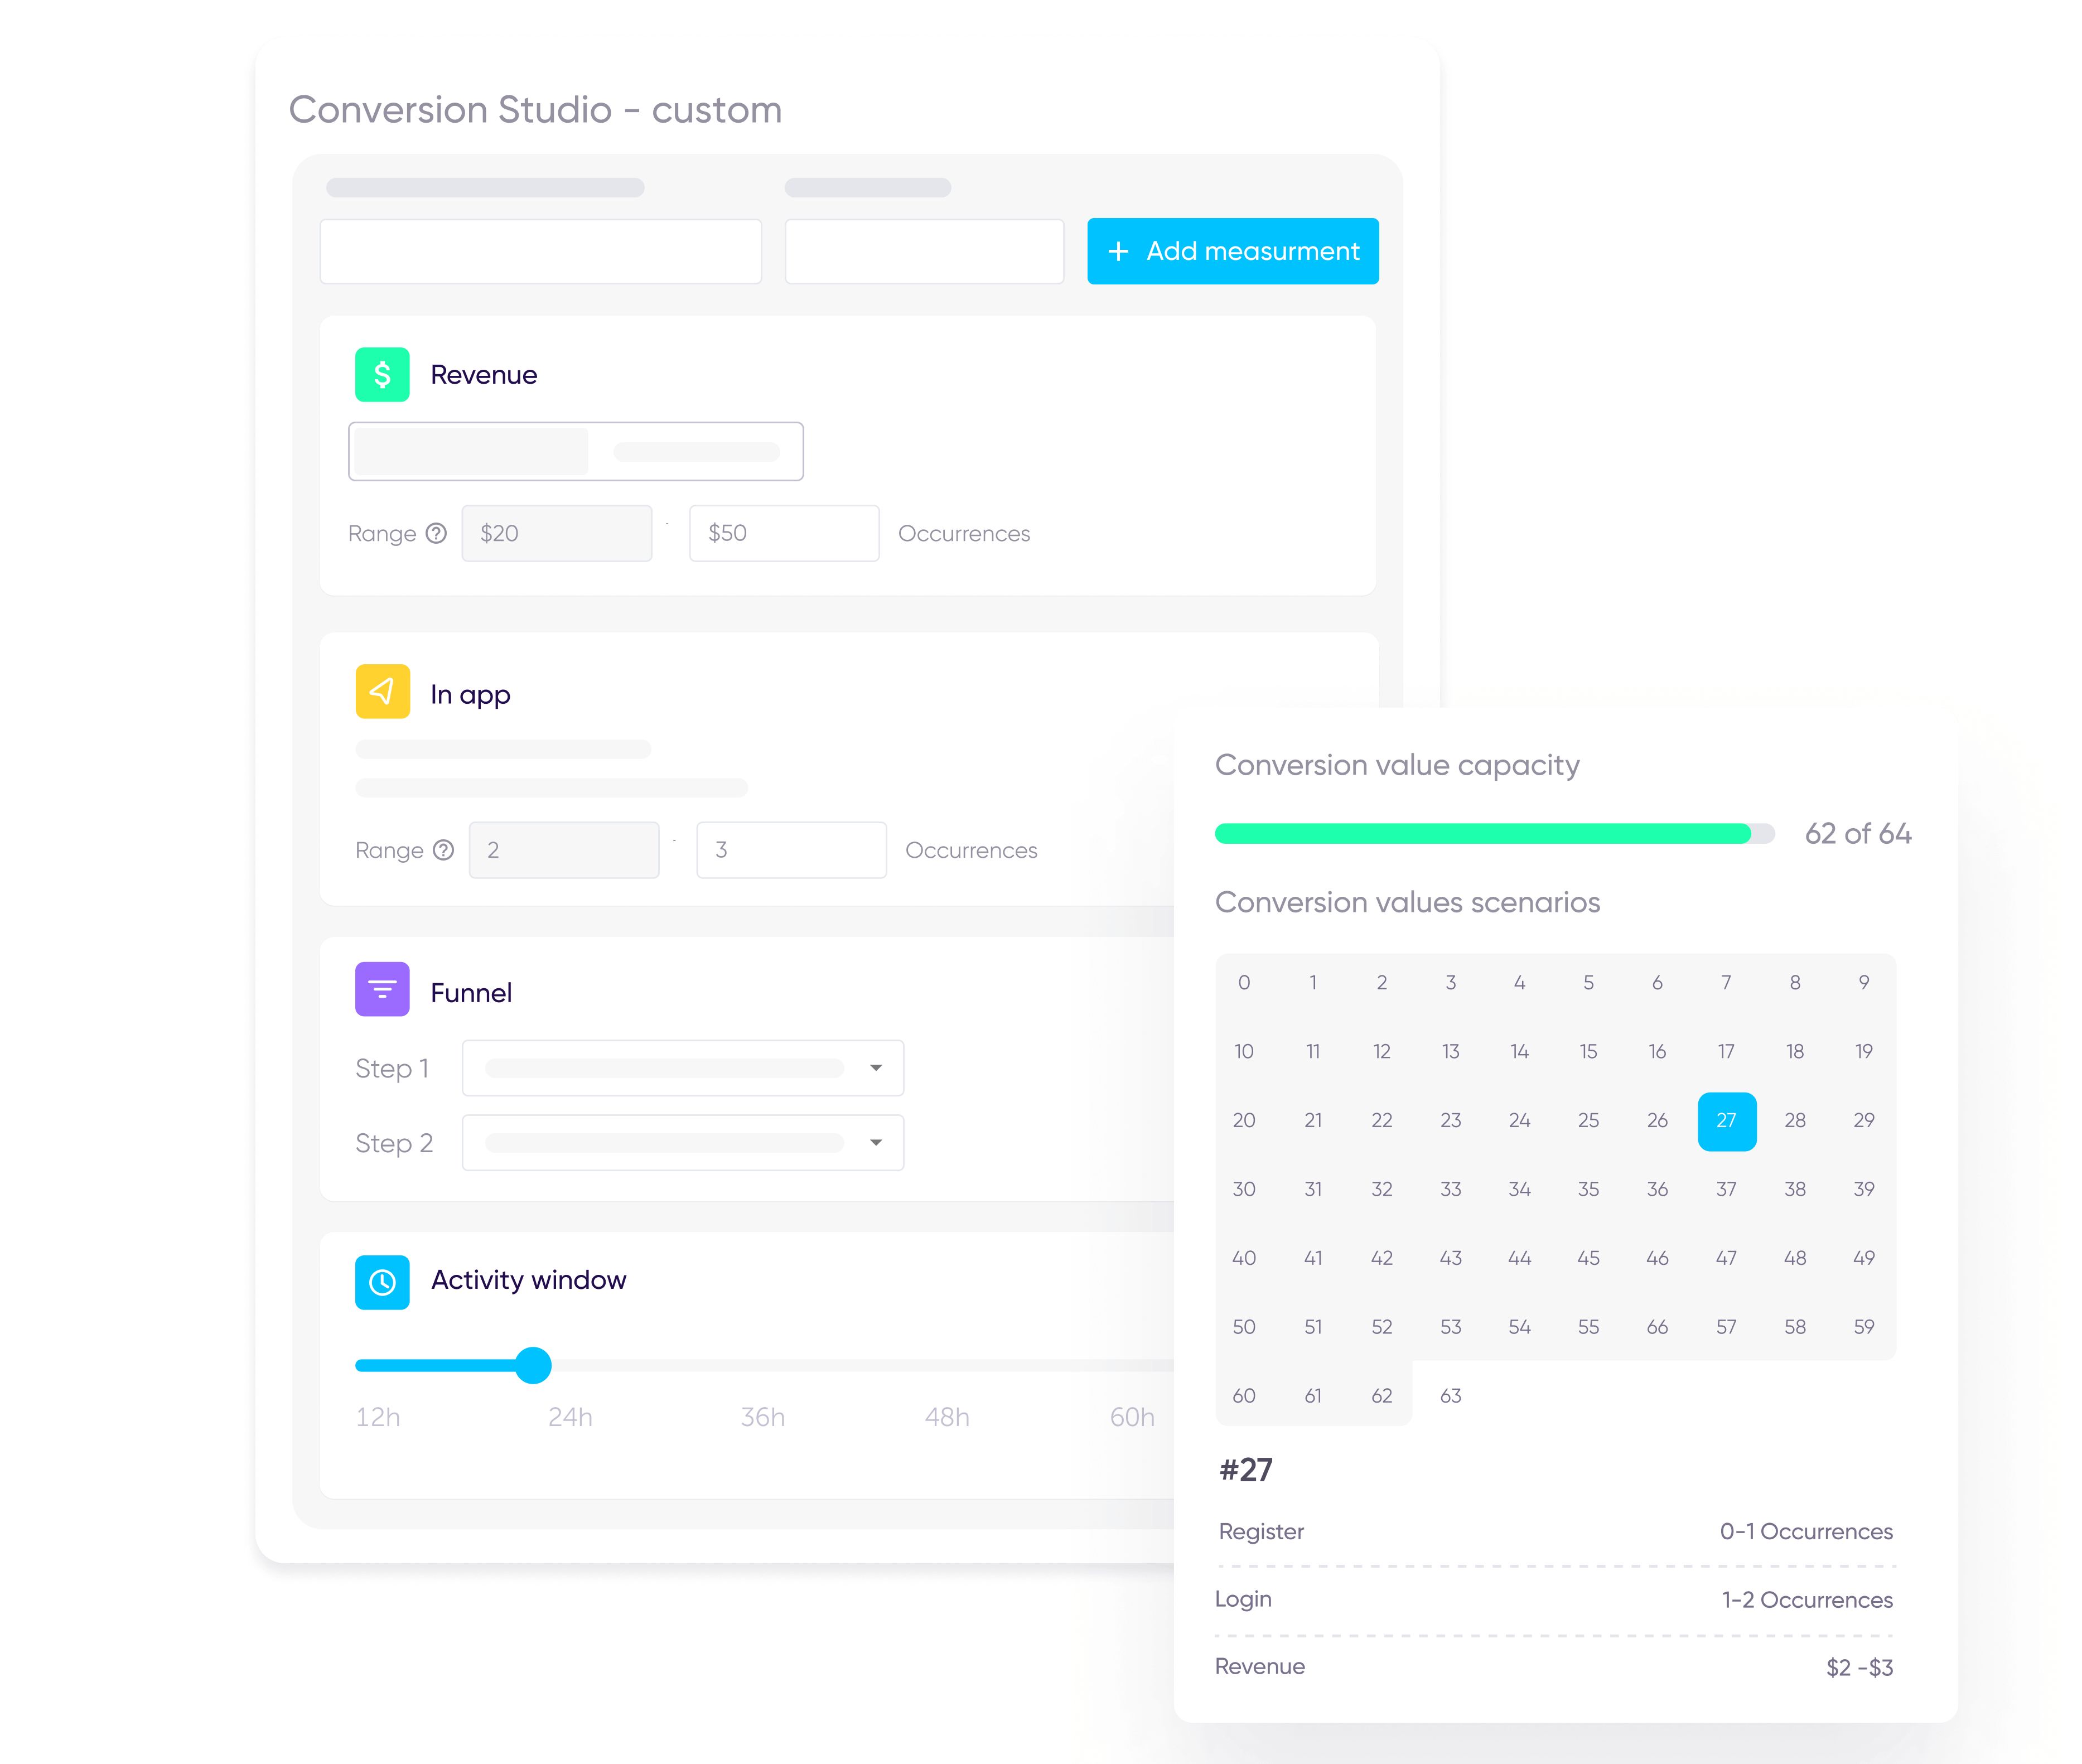
Create a map easily and intuitively within minutes, easily keeping sight of how much of the conversion value you have left for measurement.
This is big, but it’s just the beginning
We want nothing more than for you to head straight to your dashboard and start experimenting in Conversion Studio. We hope you’re as excited as we are about this huge step towards SKAN measurability and simplicity.
We’re far from done, though. This is just the beginning. Stay tuned for more features, updates and new products coming your way very soon.

