
Best mobile ad networks in 2026: The AppsFlyer Performance Index

What are the best mobile ad networks in 2026?
The AppsFlyer Performance Index has ranked mobile media sources since 2015 to help advertisers decide where to invest their user acquisition and remarketing budgets.
In the 2026 edition, the top-ranked mobile ad networks globally are AppLovin on iOS gaming, Google Ads on Android gaming and Android non-gaming, and Apple Ads on iOS non-gaming. The Index ranks 57 media sources (ad networks and platforms) using 27.2 billion installs from nearly 25,000 apps, from April 2025 through June 2026.
We grade each media source on two signals: the volume it drives and how well that volume performs after the install. The index’s power rank combines both factors. While we used to score quality with retention, in 2026, we now score it with quarter-over-quarter change in ad spend.
Why ad spend? When an advertiser puts more budget into a media source, that’s a real-world vote of confidence. It’s the advertiser’s own money moving toward what works or moving away from what doesn’t.
Because the quality signal changed, we don’t compare this year’s power rankings with last year’s. Volume rankings still compare.
The media market looks healthy in 2026. With attributed conversions and media costs both rising, 9 of the top 10 media sources saw increased ad spend year over year. So did 17 of the top 20, with the pattern holding on iOS and Android, and in gaming and non-gaming alike.
Key takeaways
- AppLovin ranks #1 in power and volume on iOS gaming. AppLovin’s power score is 82% higher than #2 Unity Ads.
- Google Ads ranks #1 in power and volume on Android gaming, with a power score more than double the #2 network’s.
- Apple Ads leads iOS non-gaming, followed by Meta Ads.
- Xiaomi climbed six spots in volume on Android gaming, the largest gain in the top tier.
- 9 of the top 10 media sources increased ad spend year over year.
The rankings below show each media source’s global power and volume rank for iOS and Android, gaming and non-gaming.
iOS gaming: AppLovin leads by a wide margin
Global power rankings, combining both value and volume factors, are presented below: for genre-specific regional rankings see full Performance Index rankings >>
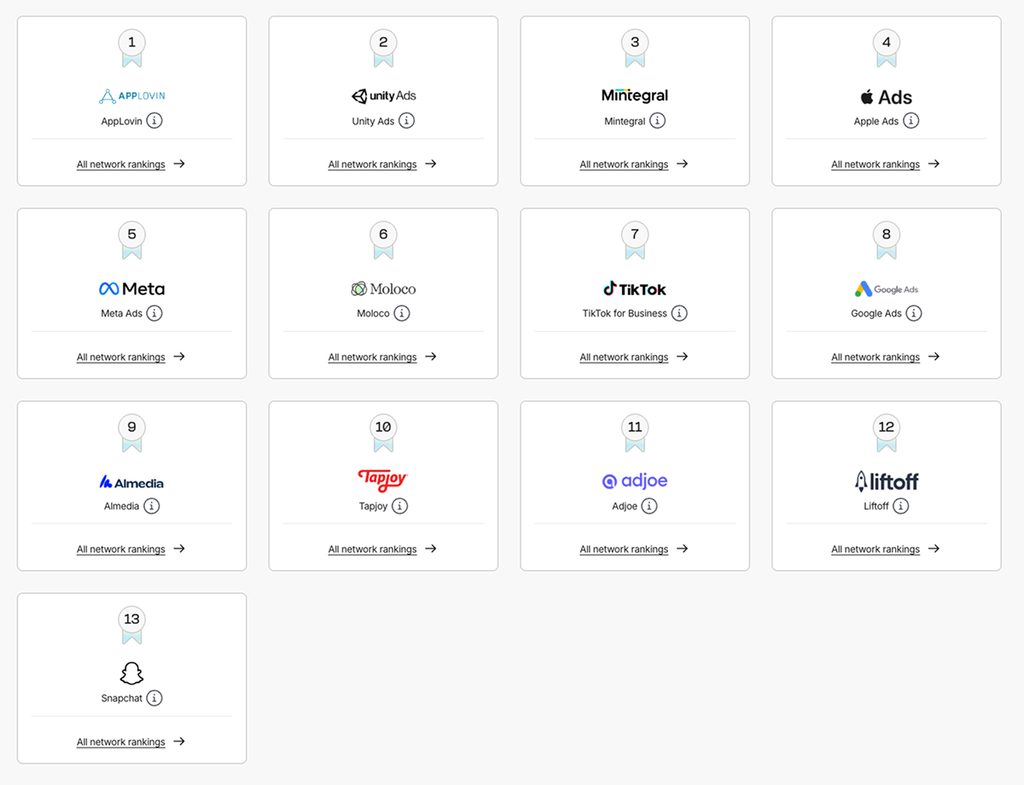
Global iOS gaming power and volume rankings:
| Media Source | Power Rank | Volume Rank |
|---|---|---|
| AppLovin | 1 | 1 |
| Unity Ads | 2 | 5 |
| Mintegral | 3 | 2 |
| Apple Ads | 4 | 4 |
| Meta Ads | 5 | 3 |
| Moloco | 6 | 8 |
| TikTok for Business | 7 | 6 |
| Google Ads | 8 | 7 |
| Almedia | 9 | 10 |
| Tapjoy | 10 | 12 |
| Adjoe | 11 | 11 |
| Liftoff | 12 | 9 |
| Snapchat | 13 | 13 |
- AppLovin ranks #1 in both power and volume rankings, climbing one spot in volume to overtake Apple Ads. AppLovin’s power score is 82% higher than #2 Unity Ads and its volume score is 70% higher than #2 Mintegral. The company cited AXON 2.0 as a growth driver on its Q1 2026 earnings call (AXON targets ads with contextual signals instead of Apple’s IDFA).
- Unity Ads ranks #2 in power after climbing two spots in volume to #5. Consolidating ironSource demand onto Unity Ads is the likely factor.
- Mintegral ranks #3 in power and #2 in volume, up one spot in volume compared to the previous index.
- Apple Ads ranks #4 in both rankings, but fell three spots in volume.
- Meta Ads ranks #5 in power and #3 in volume.
- Moloco ranks #6 in power and #8 in volume, up one spot in volume.
Android gaming: Google Ads holds the top spot as Xiaomi climbs
Global power rankings, combining both value and volume factors, are presented below: for genre-specific regional rankings see full Performance Index rankings >>
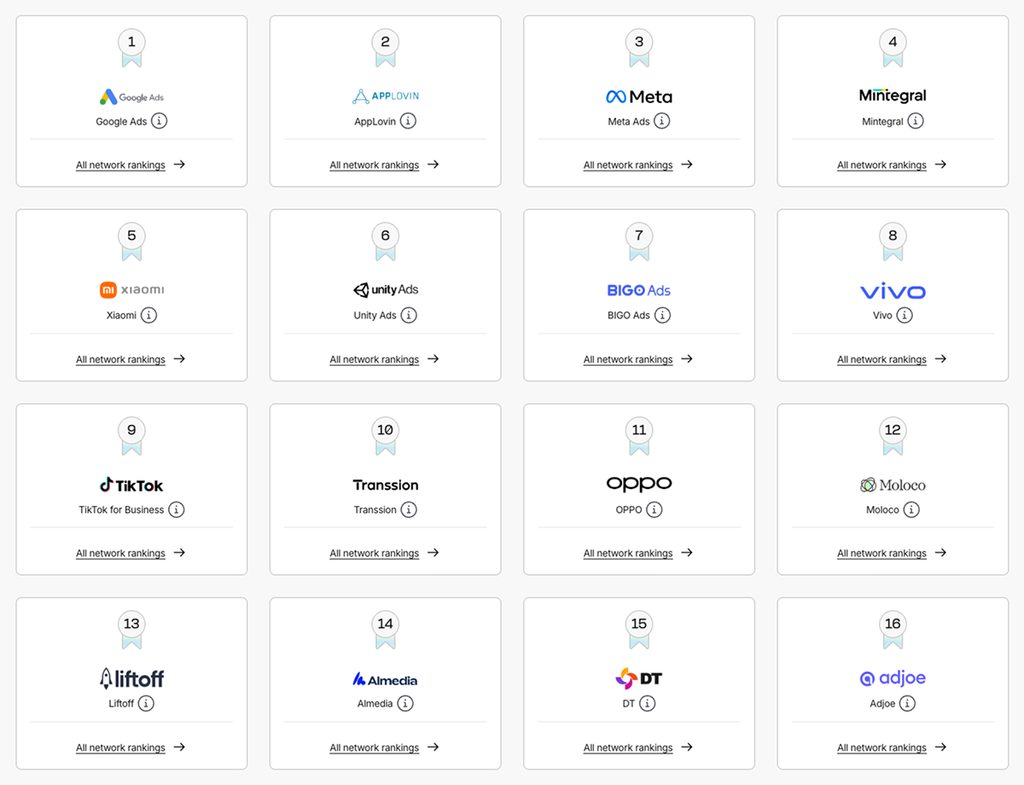
Global Android gaming power and volume rankings:
| Media Source | Power Rank | Volume Rank |
|---|---|---|
| Google Ads | 1 | 1 |
| AppLovin | 2 | 3 |
| Meta Ads | 3 | 5 |
| Mintegral | 4 | 2 |
| Xiaomi | 5 | 8 |
| Unity Ads | 6 | 4 |
| BIGO Ads | 7 | 15 |
| Vivo | 8 | 14 |
| TikTok for Business | 9 | 6 |
| Transsion | 10 | 13 |
| OPPO | 11 | 9 |
| Moloco | 12 | 10 |
| Liftoff | 13 | 19 |
| Almedia | 14 | 20 |
| DT | 15 | 7 |
| Adjoe | 16 | 12 |
| Mistplay | 17 | 18 |
| InboxDollars | 18 | 23 |
| YSO Network | 19 | 17 |
| Tapjoy | 20 | 16 |
- Google Ads ranks #1 in power and volume. Its power score is more than double the #2 network’s.
- AppLovin ranks #2 in power and #3 in volume. AppLovin’s volume rank is unchanged.
- Meta Ads holds #3 in power and #5 in volume, down one spot in volume.
- Mintegral ranks #4 in power and #2 in volume, the same volume spot as last year.
- Xiaomi ranks #5 in power and #8 in volume. Xiaomi climbed six spots in volume, the largest gain in the top tier. OPPO and Vivo also gained in volume, rising to #9 and #14. OEM ad networks are gaining real traction among games.
iOS non-gaming: Apple Ads leads, Meta follows
Global power rankings, combining both value and volume factors, are presented below: for genre-specific regional rankings see full Performance Index rankings >>
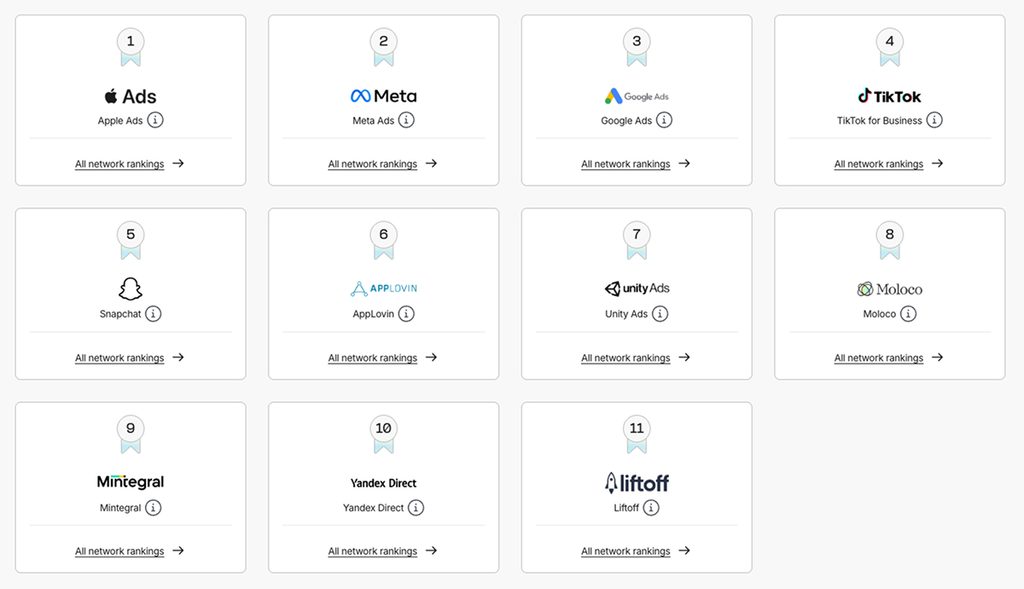
Global iOS non-gaming power and volume rankings:
| Media Source | Power Rank | Volume Rank |
|---|---|---|
| Apple Ads | 1 | 1 |
| Meta Ads | 2 | 2 |
| Google Ads | 3 | 4 |
| TikTok for Business | 4 | 3 |
| Snapchat | 5 | 6 |
| AppLovin | 6 | 5 |
| Unity Ads | 7 | 10 |
| Moloco | 8 | 7 |
| Mintegral | 9 | 8 |
| Yandex Direct | 10 | 11 |
| Liftoff | 11 | 9 |
- Apple Ads ranks #1 in power and volume, the clearest leader in iOS non-gaming. Search intent drives conversion, and high advertiser LTV in Finance, Shopping, and Software keeps spend rising.
- Meta Ads ranks #2 in both rankings.
- Google Ads ranks #3 in power and #4 in volume, well below its Android position.
- TikTok for Business ranks #4 in power and #3 in volume.
- Snapchat ranks #5 in power and #6 in volume.
- AppLovin ranks #6 in power and #5 in volume, up one spot in volume. A network built for gaming, AppLovin now has a real presence in non-gaming as well.
Android non-gaming: Google and Meta lead, with DT and Vivo in the top 5
Global power rankings, combining both value and volume factors, are presented below: for genre-specific regional rankings see full Performance Index rankings >>
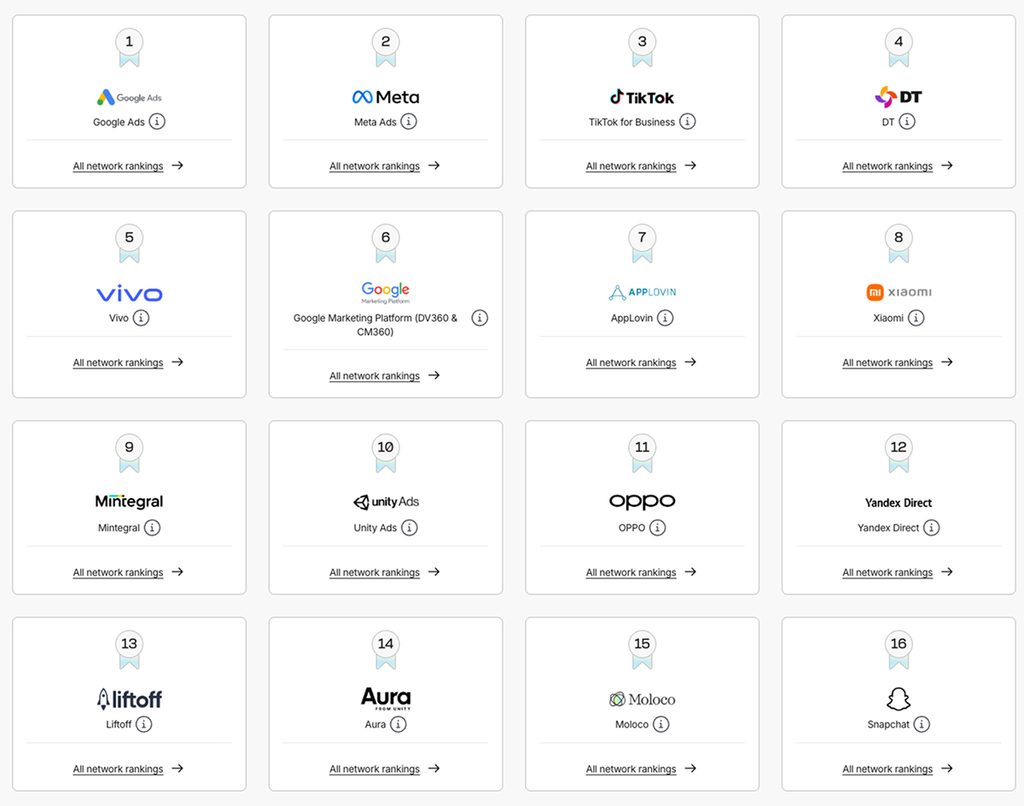
Global Android non-gaming power and volume rankings:
| Media Source | Power Rank | Volume Rank |
|---|---|---|
| Google Ads | 1 | 1 |
| Meta Ads | 2 | 2 |
| TikTok for Business | 3 | 3 |
| DT | 4 | 13 |
| Vivo | 5 | 8 |
| Google Marketing Platform (DV360 & CM360) | 6 | 14 |
| AppLovin | 7 | 7 |
| Xiaomi | 8 | 5 |
| Mintegral | 9 | 4 |
| Unity Ads | 10 | 15 |
| OPPO | 11 | 6 |
| Yandex Direct | 12 | 11 |
| Liftoff | 13 | 10 |
| Aura | 14 | 12 |
| Moloco | 15 | 9 |
| Snapchat | 16 | 16 |
- Google Ads ranks #1 in power and volume, as it does in Android gaming.
- Meta Ads ranks #2 in both rankings.
- TikTok for Business ranks #3 in both rankings.
- DT ranks #4 in power, winning through device-level distribution, with apps that carriers and OEMs preload, instead of auction bidding. Preloaded apps carry a trust signal, and pre-install users tend to show solid retention, conversion, and loyalty.
- Vivo ranks #5 in power, driven largely by Finance in the Indian Subcontinent.
The complete AppsFlyer Performance Index covers:
- User acquisition and remarketing rankings for Android and iOS, covering up to 10 genres and categories across 11 regions
- The Creative Index: find out which media sources excel in various creative video formats like gameplay, UGC, and animated assets
- Performance and volume rankings for Google, Meta, Apple, TikTok, Unity, AppLovin, Snap, Moloco, and many others
Frequently asked questions
AppLovin ranks #1 in both power and volume for iOS gaming in the AppsFlyer Performance Index.
Google Ads ranks #1 in both power and volume for Android gaming in the AppsFlyer Performance Index.
Apple Ads leads iOS non-gaming and Google Ads leads Android non-gaming in the AppsFlyer Performance Index.
The Performance Index combines the volume a network drives with a quality signal. The 2026 quality signal measures quarter-over-quarter change in ad spend.
No. The methodology changed. Volume rankings still compare.