
Introduction to advanced TV: Key trends in the OTT market


With the rise of cord cutting behavior, connected TV (CTV) recently surpassed mobile in terms of total video ad impressions served.1 Although traditional TV still reigns supreme, its market share has been declining in lieu of over the top (OTT) viewing.2
The advent of OTT has made TV advertising more accessible to mobile-first marketers who previously could not have afforded to fit TV into their performance advertising plan.
Beyond the clear synergies between OTT and mobile for app advertising across screens, addressable buying methods have lowered minimum spend requirements while offering more sophisticated targeting than traditional TV.
However as a medium mixed between traditional and digital realms, it can be unclear where the management of OTT television media should fall within your organization.
On the one hand, OTT is an upper funnel tactic and there may be advantages of buying OTT within traditional TV packages from a pricing perspective.
On the other hand, the tactical planning and/or execution of OTT may be better suited for digital performance teams for a few reasons:
- OTT can be accessed through the same partners as digital (i.e. programmatic or publisher direct)
- Working with a programmatic partner to buy OTT, desktop and mobile inventory in a package lends lower CPMs and minimum spends, in addition to facilitating sequential messaging strategies (i.e. OTT TV → digital)
- Advanced OTT targeting and measurement options should be considered in parallel with digital performance forecasting, planning and optimization
That being said, OTT is still a grey area for many – with superfluous TV terminology, fragmented options for media buying, and unclear expectations for performance and measurement, it can be tricky to know where to start.
If you’re new to OTT or want to convince your team that testing OTT is worthwhile, we’re here to help.
As an attribution authority offering integrated measurement of mobile and OTT, we’ll give you the 411 on the OTT television landscape with a new content series:
- Introduction: This first post will provide an introduction to OTT television with key trends that illustrate the value of the OTT audience, viewing behaviors, as well as how OTT is growing by usage, spend and market share.
- Measurement: We’ll not only cover the technical details of how OTT measurement works with AppsFlyer, but we’ll also explain other industry solutions that will help you plan out your cross-device measurement strategy.
- Amazon Fire TV: Coming out of beta testing with Fire TV in Q4, we’ll shed more light on how the integration works as well as Fire TV media options.
- Media Buying: Jumpstart your OTT test strategy with expert advice on media sources by category, targeting options, performance expectations and more.
Introducing OTT measurement with AppsFlyer
As part of our ongoing effort to provide 360° measurement of the digital ecosystem, AppsFlyer is proud to support the following OTT platform integrations:
This list is just the beginning, as we’ll continue to develop new and more advanced measurement integrations in the coming months.
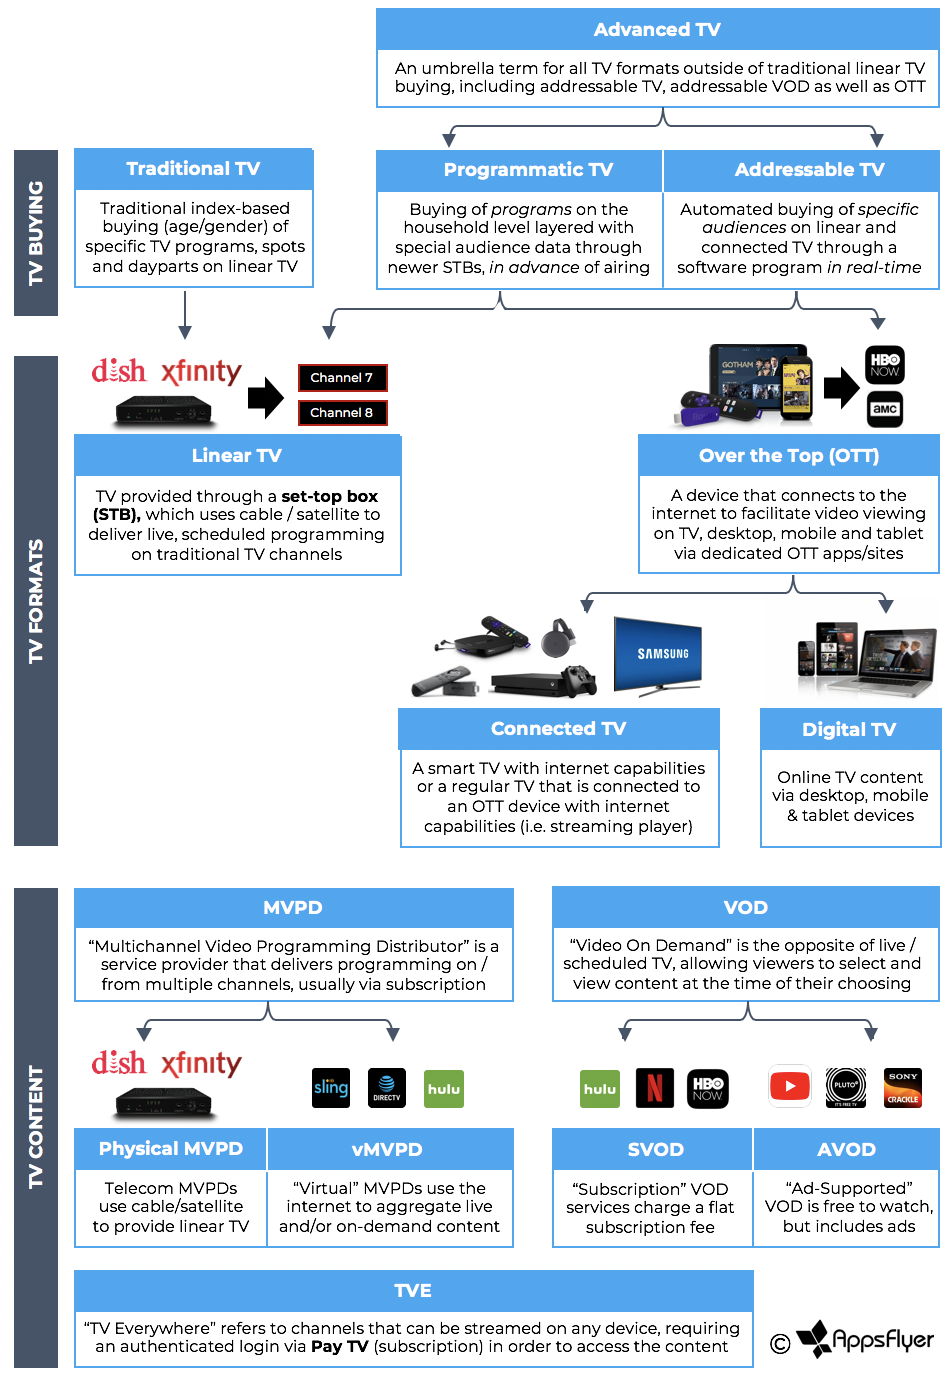
Defining advanced TV terminology
Advanced TV terminology can be complicated and often inconsistent depending who you ask,3 so let’s take a moment to clarify a few definitions.
To begin with, advanced TV is an umbrella term for non-traditional TV buying.
Within advanced TV, the most common method for buying OTT ads is addressable TV – although confusingly, you’ll often find DSPs and digital trade desks refer to this as programmatic buying in line with the digital definition of programmatic.
Regardless of who you buy from, asking about their methodology is key to understanding what you’ll get out of it. Lastly when considering your OTT/CTV buying strategy, there are important distinctions to consider in terms of how TV formats are labeled as well as the type of content delivered for targeting purposes.
Key trends to watch
From a volume perspective, it’s true that OTT still represents a small chunk of the U.S. market – about $2B in advertising compared to $63B for traditional TV in 2018.2
Traditional TV spend has been slowly declining since 2016, making the trajectory for OTT impossible to ignore.4
There is significant potential for investing in OTT now, given its strong YoY growth rates in ad spend (+40% vs. +1% for traditional TV)2 and user behavior (+17% U.S. homes using OTT / +28% total time spent streaming OTT).5
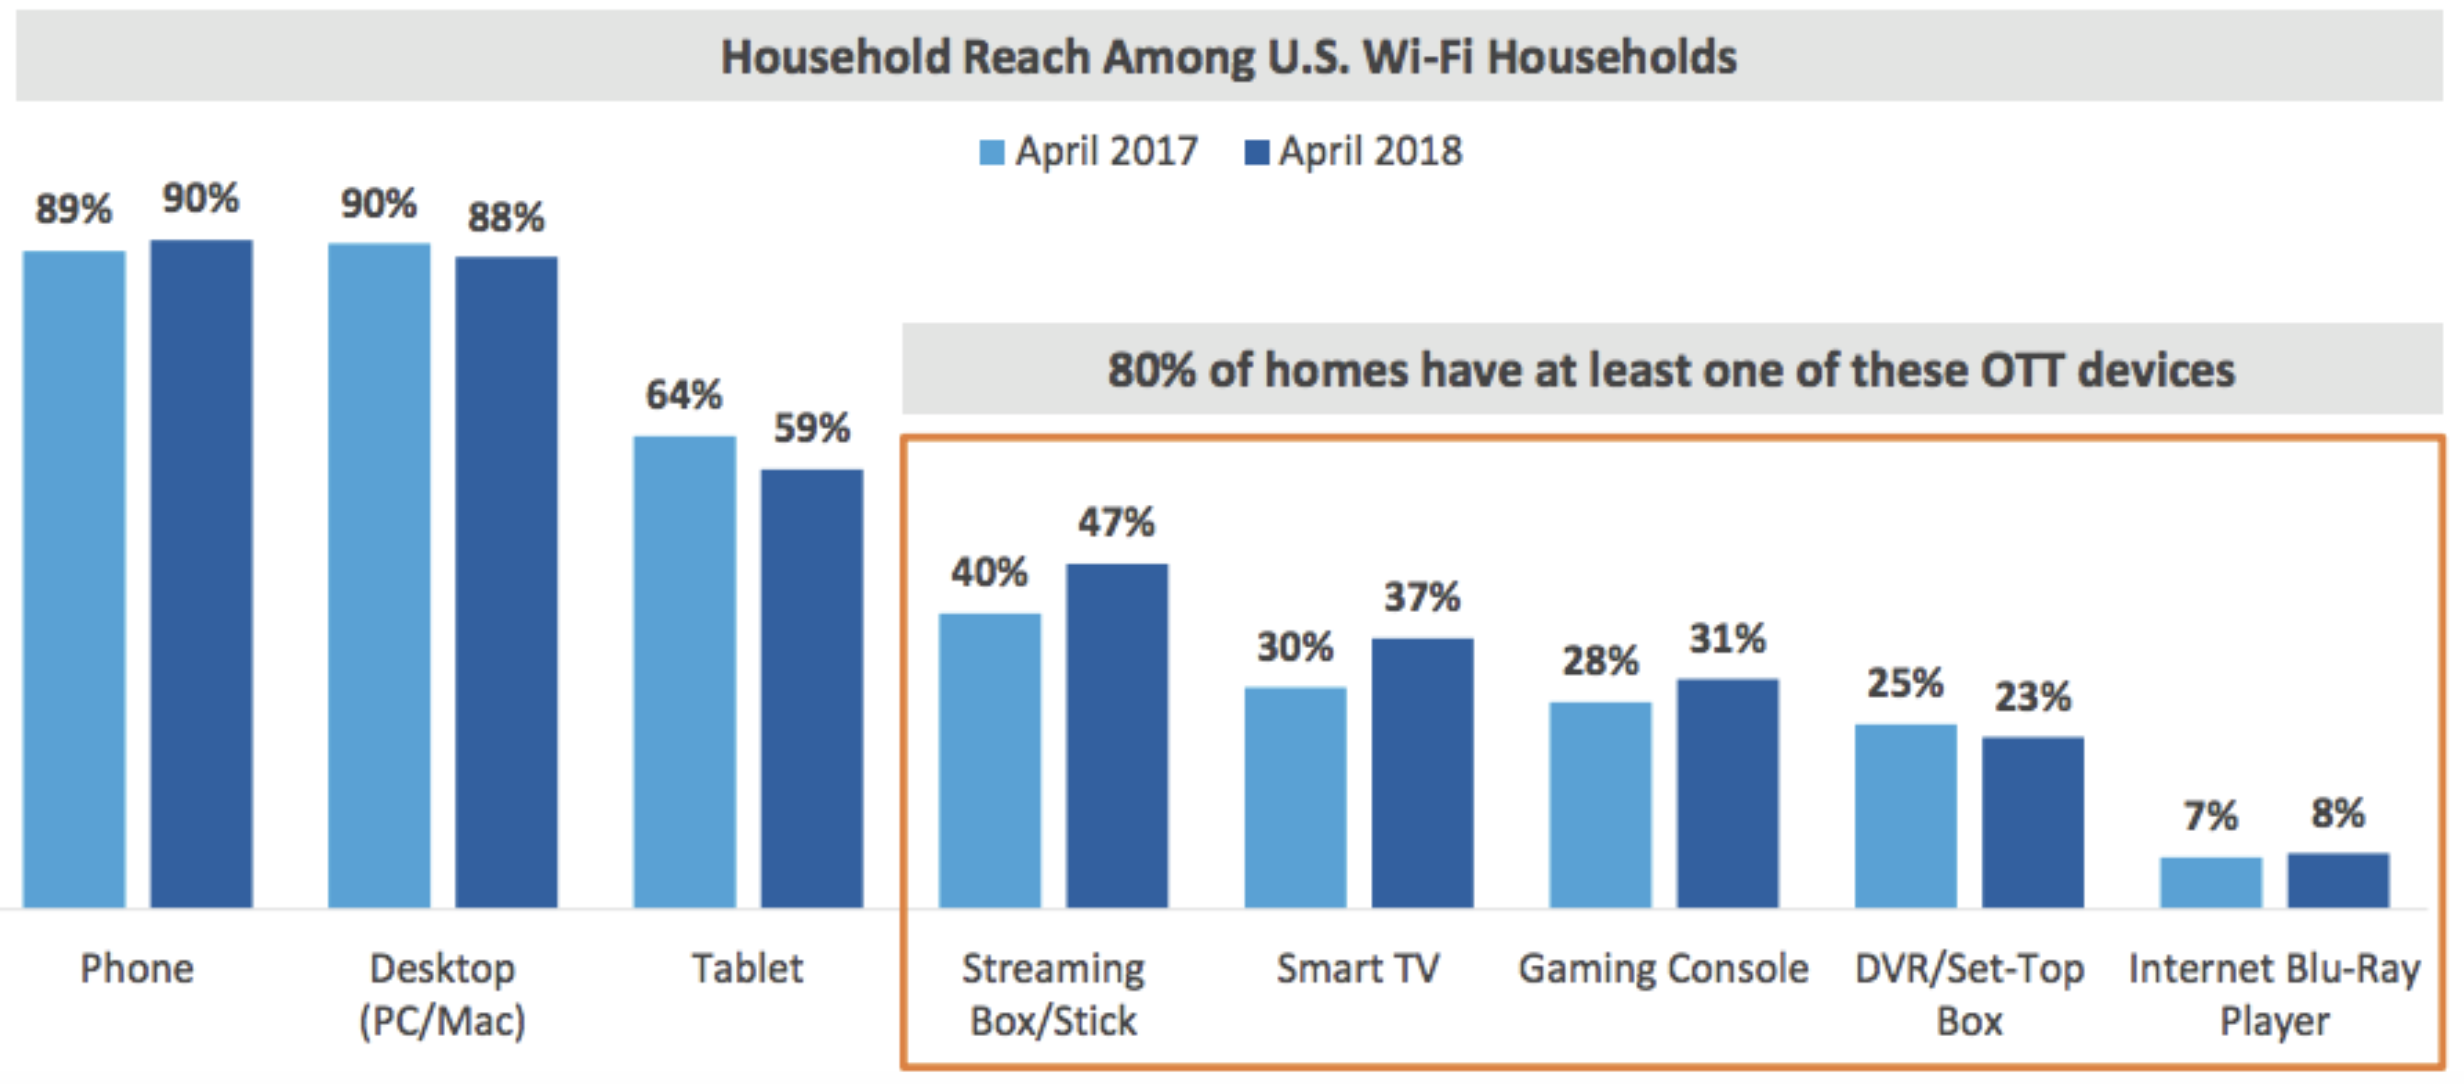
Trend #1: CTV is outpacing linear TV
Overall, 80% of U.S. WiFi households have at least one OTT device, of which 47% own a streaming box/stick, 37% own a smart TV and 34% are cordless (non-subscribers of pay-TV).5
CTV access is growing while set-top box ownership is declining. In fact, smart TVs represented almost 9 in 10 TVs sold in the US during Q1.6
Trend #2: TV streamers are more engaged, but attention is limited
Overall, OTT viewers are a highly engaged audience – especially on TV, the preferred screen for 75% of OTT streamers.6 Consequently, OTT app owners often find that those who watch on CTV are stickier than those who watch only on mobile.
CTV viewers are also more engaged with ads than their desktop/mobile counterparts (2x longer ad engagement time + 25% higher completion rate).
This trend is magnified on OTT over linear TV, as OTT viewers are more likely to say their second-screen activity is completely or mostly related to the program or ads.7 This may have something to do with the ad format of OTT apps, which are non-skippable (no DVR) and tend to have fewer commercials with less ad time than linear TV.
The high engagement of OTT/CTV viewers bodes well for advertisers looking to promote awareness.
However, competition is fierce for most OTT/TVE app owners, as viewership is dominated by the “big 4” OTT apps. Together, Netflix, YouTube, Amazon Video, and HULU comprise 75% of total OTT time spent.5
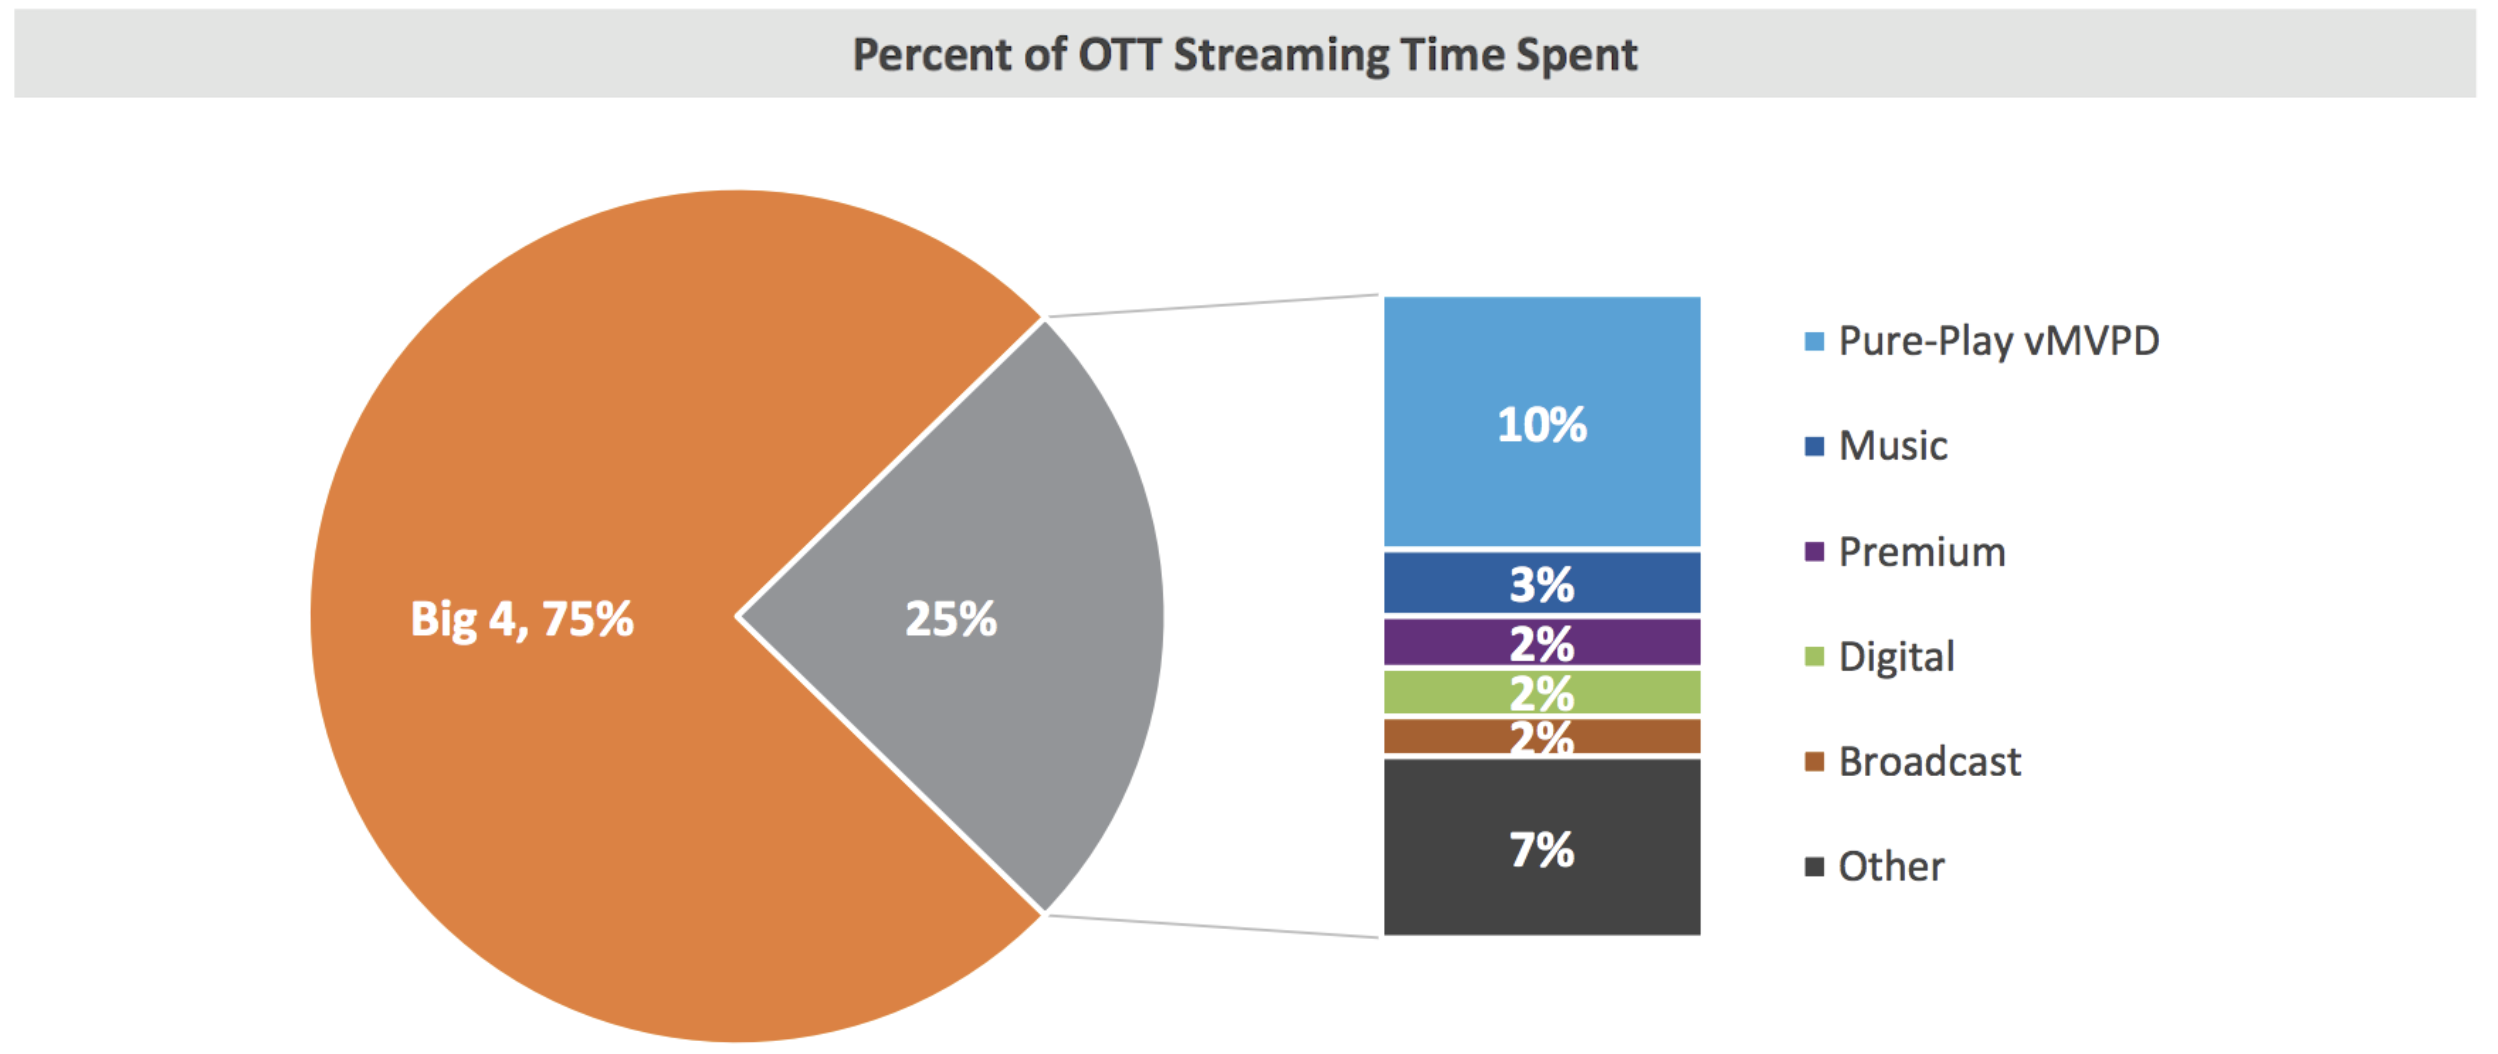
Trend #3: A few CTV players dominate the market
Similar to the concentration seen among the big 4 OTT apps, CTV platform share is dominated by a few major players.
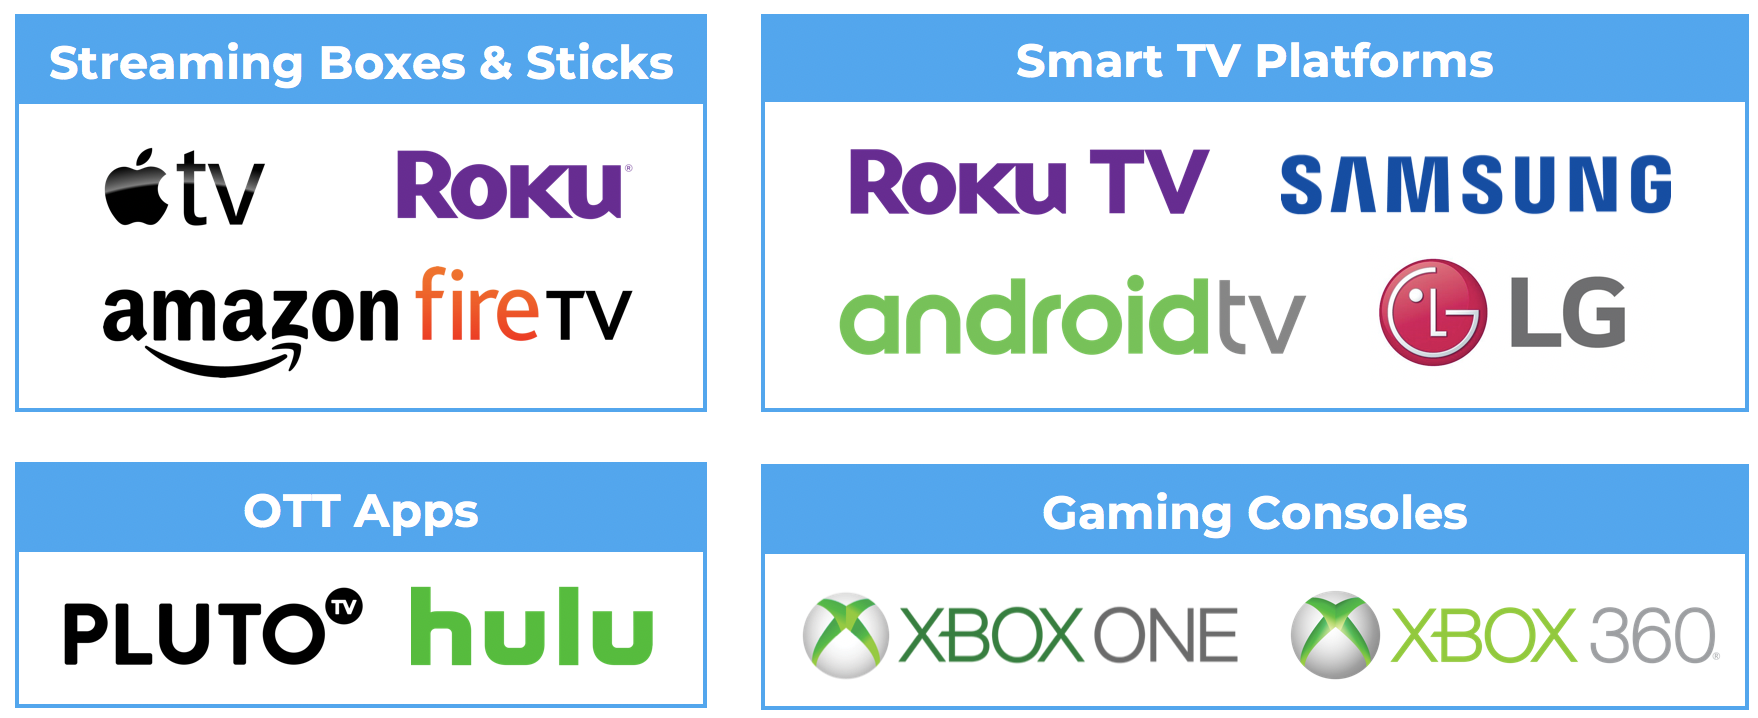
Let’s zoom in on the top two categories – streaming boxes/sticks (36% of OTT devices for TV) and smart TVs (20%):5
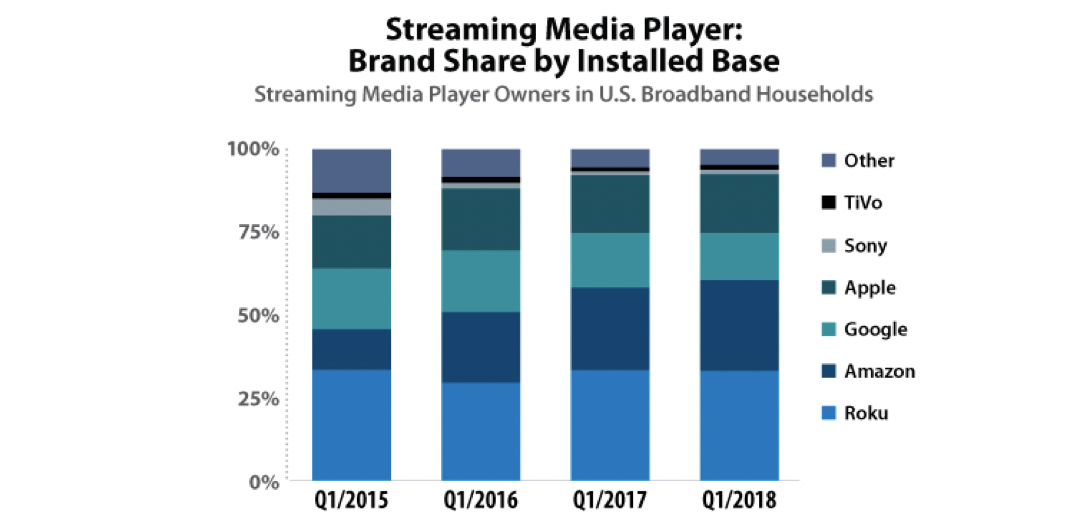
Streaming Boxes/Sticks
Together, Roku and Fire TV comprise over 60% of the U.S. installed base for streaming media players.8 Roku has been the dominant player since OTT’s origins a few years ago, but Amazon has been quickly catching up and recently announced figures that seem to beat Roku for the first time.
As CNET reported last week, Fire TV now has over 30 million active users, whereas Roku reported 27 million active users in Q4 2018.9
Get the latest marketing news and expert insights delivered to your inbox
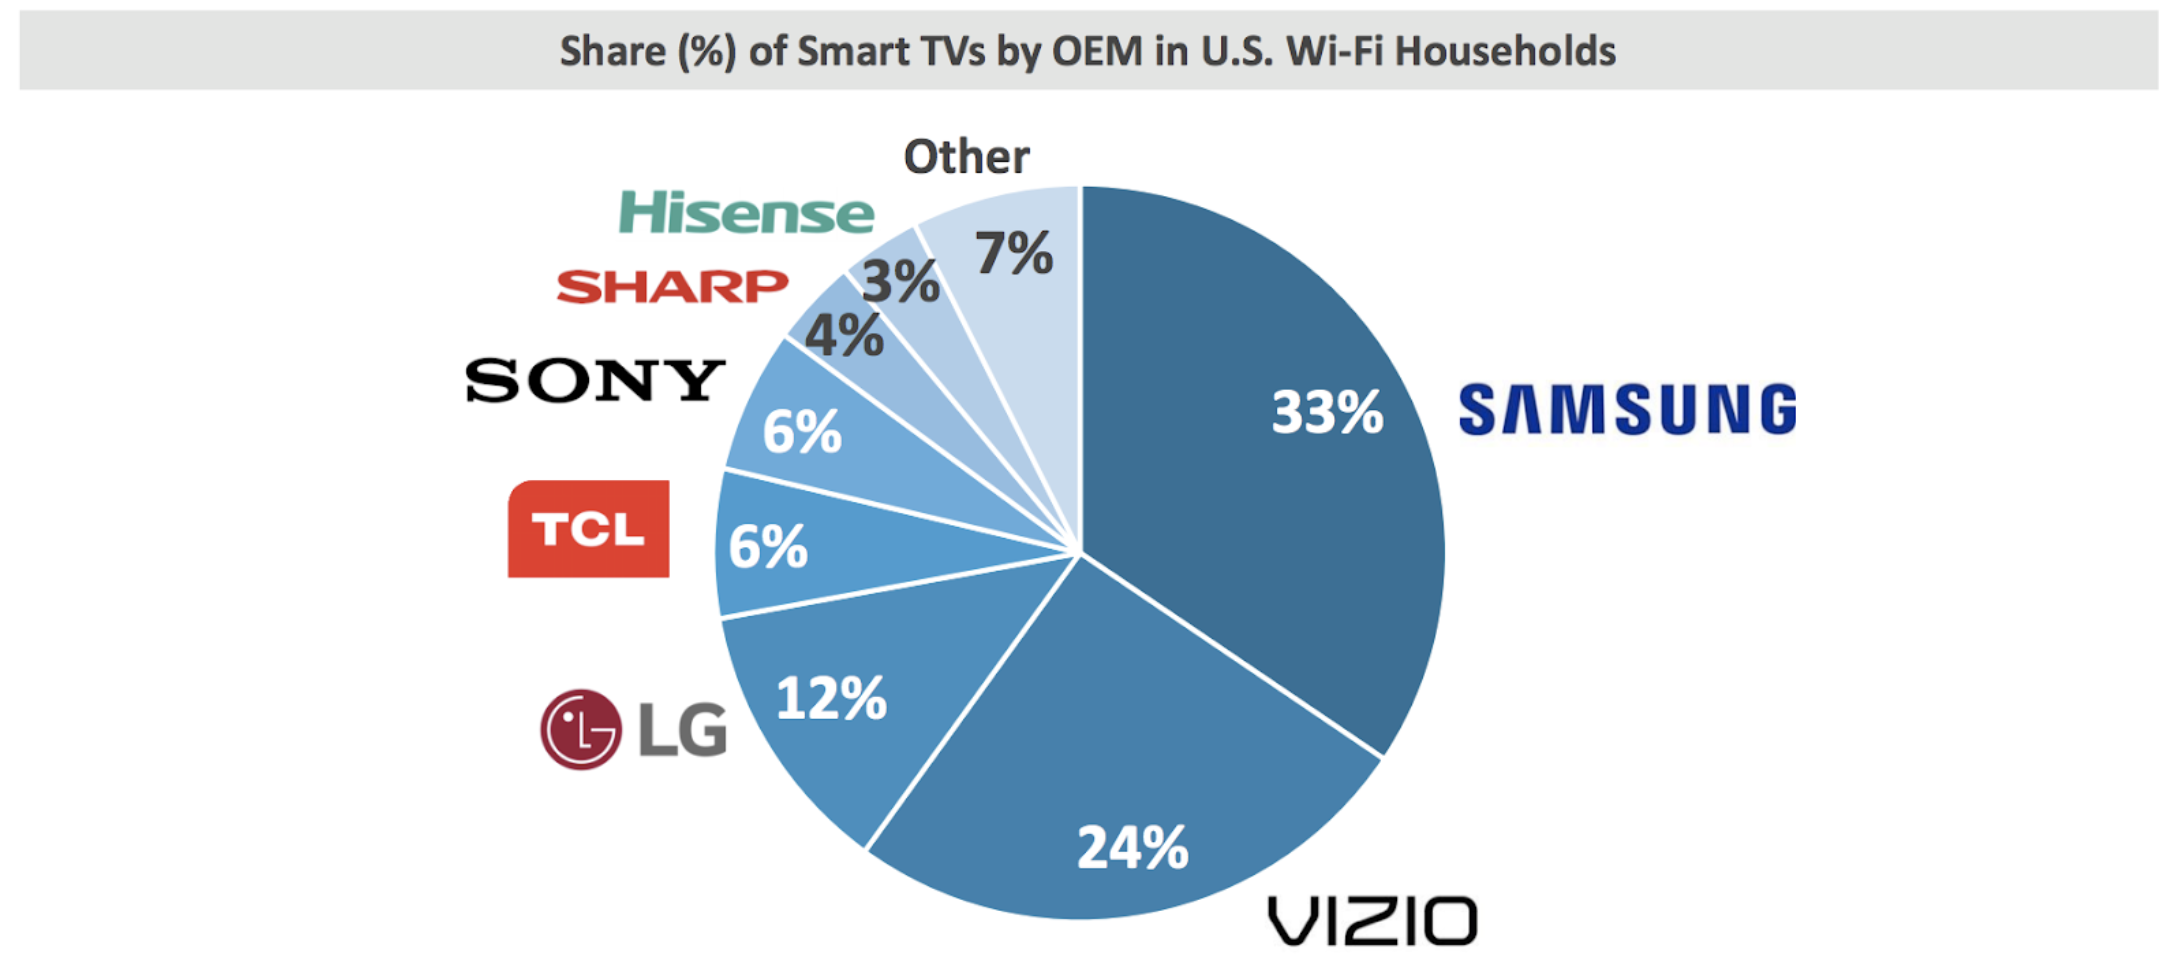
Smart TV Brands
Likewise among smart TV brands, two players comprise 57% of the OEM market share with Samsung leading over VIZIO.5
These trends are important to consider for OTT advertising, as marketers will want to focus their attention on the highest reaching players. We’ll dive deeper into how to navigate this from a measurement and buying perspective on our next few posts.
Research sources
- Extreme Reach, “Q2 2018 Video Benchmarks”, U.S., Q2 2018
- MAGNA via Marketing Dive, “OTT ad spending will leap 40% to $2B in 2018, Magna Finds”, U.S., Sept. 2018
- WYWY, eMarketer, Altitude Digital, LinkedIn, Wikipedia
- eMarketer, “Total Media Ad Spending, US”, Sep 2018
- comScore Connected Home, “State of OTT: An in-depth look at today’s over-the-top content consumption and device usage”, U.S., April 2018
- Adobe Digital Insights, “Digital Dollar Report”, U.S., Q1 2018
- Nielsen, Maru/Matchbox and Brightline via Video Advertising Bureau (VAB), “Linear TV and OTT: Living Together in Harmony”, U.S., Nov. 2018
- Parks Associates, U.S., Q1 2018
- CNET, “Amazon Fire TV tops 30 million active users, seeming to beat Roku”, Jan. 10, 2018