“The value wasn’t just measuring web: it was measuring web with the same level of sophistication as mobile. Now web and mobile are one story, and that’s changed where we invest.”


Try searching for


Here’s what I keep hearing from marketing teams running campaigns across mobile, web, and CTV: Meta says it drove the sale. So does Google. So does the CTV partner that ran the pre-roll ad three days earlier. Add up what every platform claims and you’re crediting the same customer two or three times over, and somebody’s going to ask you which number is real.
That’s the attribution problem underneath every ROAS conversation. Not “did marketing work,” everyone can point to a chart. The real question is whether you can trace what actually drove a result back to the touchpoint that caused it, and say so out loud without hedging.
With over $160 billion spent on in-app purchases in 2025 alone (source), different platforms claiming the same conversion is a lot more than a reporting glitch. It’s structural: every platform measures what it can see, and credits itself for that. But none of them know that two other channels have claimed the same.
Revenue attribution tells you what touched a customer on the way to an actual sale, not just a click or an install. That’s fine for measuring reach, but it doesn’t tell you which touchpoint you can actually defend when someone asks why a channel got the budget it did. Revenue attribution is the layer that closes that gap, between “here’s activity” and “here’s what I can prove drove the outcome,” which is where most measurement setups quietly fall apart.
Revenue attribution goes beyond traffic and installs. It shows downstream purchases or subscriptions that have an actual dollar value attached. It measures the full mix of surfaces: mobile, web, CTV, and AI-assisted journeys.
It’s not without challenges, though: siloed data prevents surfaces from connecting, attribution models need to be designed for cross-platform journeys, and some platforms overclaim credit that can skew your overall numbers. That overclaim is where I’ll start as I show you how to navigate and solve these challenges.
Revenue attribution solves the revenue half of that equation. The other half is cost, and it’s just as fragmented, since no two networks report spending the same way. For the full picture of what accurate ROI requires on both sides, see our guide to measuring true ROI.
Every platform grades its own homework. Meta’s dashboard isn’t lying when it claims a conversion, it’s just not built to know that Google and your CTV partner are claiming the exact same one. Nobody’s platform is going to volunteer that another channel deserves the credit instead.
That’s not a minor rounding error. It’s the reason two people in the same meeting can look at the same campaign and argue about whether it worked, because they’re each looking at a number built by a different platform’s self-interest.
This creates cross-platform blind spots, and the only way to get a number you can actually defend is by using an independent measurement layer that sits outside any platform’s interest in the outcome.
A quick example of what platform overclaim looks like and why it’s breaking your revenue attribution:
Picture a single customer: a CTV ad on Monday, a Meta click on Tuesday, a mobile app open on Wednesday, a purchase from their laptop the following week. One person. Four platforms, each with its own idea of who gets the credit.
In a siloed setup, this single customer gets treated as multiple separate entities: your CTV partner reports the impression, Meta claims the signup as a conversion, your app’s attribution stack claims the $50 purchase, and your web attribution captures the $100 PC purchase.
It’s a structural problem that breaks your ability to read your customer’s true lifetime value (LTV) and identify what actually started your customer’s journey. It also corrupts the learning ability of any automated bidding systems or Agentic AI you might have in place now or in the future.
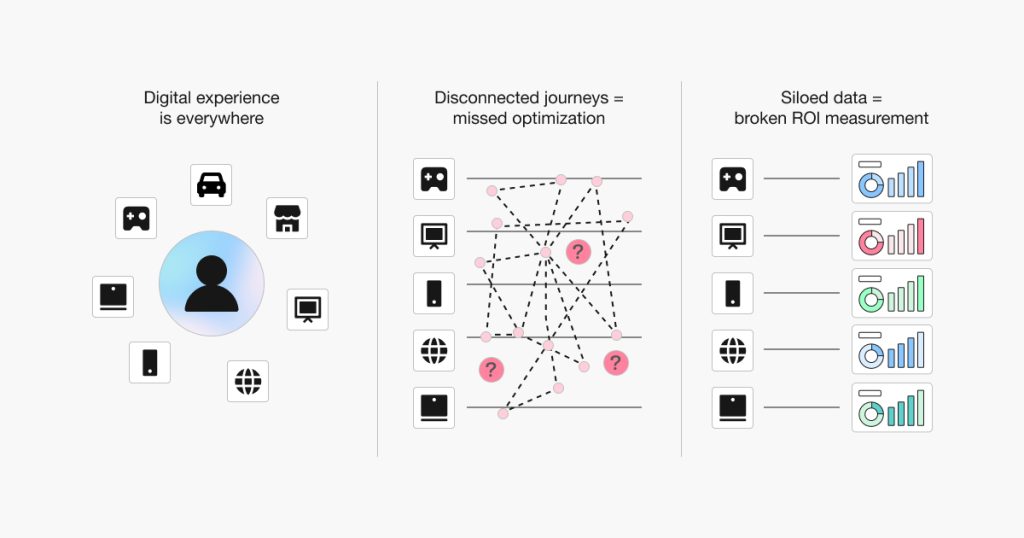
Fortunately the answer isn’t more spreadsheet hours. With a persistent customer identity that follows users across surfaces, along with the ability to deduplicate your numbers, you can put effective revenue attribution in place and get a better understanding of your ROAS.
Before I walk through how to implement your own revenue attribution model, let’s quickly review the different models out there and their individual limitations.
Here’s the table I’d put in front of a CMO before they pick a model, because the honest answer to “which one’s best” is “it depends what you’re trying to defend.” A model built for a single-channel funnel will make you look bad the moment a customer touches CTV and mobile in the same week.
Here’s a brief overview of what each revenue attribution model and measurement approach does, and where it can fall short.
| Model | How credit is assigned | Best for | Real limitation |
|---|---|---|---|
| First-touch | 100% to the first touchpoint | Brand awareness campaigns, top-of-funnel measurement | Ignores everything that happened between discovery and purchase |
| Last-touch | 100% to the final touchpoint before conversion | Simple, single-channel funnels | Overstates lower-funnel channels (re-engagement, branded search) |
| Linear | Equal credit across all touchpoints | Getting a baseline cross-channel view | Treats a CTV impression the same as a purchase-intent search click |
| Time-decay | More credit to recent touchpoints | Short consideration cycles | Undervalues upper-funnel brand investment |
| Position-based (U-shaped) | 40% first, 40% last, 20% middle | Balancing awareness and conversion credit | The 40/40/20 split is arbitrary and doesn’t reflect real funnel behavior |
| Data-driven (DDA) | Algorithmic, based on actual path data | High-volume funnels with historical data | Requires significant data volume to work reliably |
| Multi-touch (MTA) | Distributed across all tracked touchpoints | Complex, multi-step digital journeys | Only works if every touchpoint is visible and stitched, which rarely holds for cross-surface journeys today |
| Incrementality testing | Causal lift from a holdout experiment | Validating whether any model’s output is accurate | Requires setup, controlled experiments, and enough volume to produce reliable results |
Revenue attribution isn’t something you can just build and leave to do its thing. It’s a framework that you maintain over time as your surface mix and customer behavior evolves.
This is as a stack you keep an eye on rather than a one-time setup. The moment you add a new channel or your customers start behaving differently, the number you were pointing to last quarter stops being true. Here’s what I’d actually check, in order, but for a deeper dive into identity-layer mechanics check out our cross-platform measurement guide.
The first step is the most important, as this definition will determine everything that comes downstream. You need to define the specific in-app or on-site action that represents actual money in. For a subscription business, it’s the first payment; for eCommerce, it’s the completed purchase. This is revenue attribution, not clicks, sessions, or installs.
List every possible surface a customer could interact with your brand before converting: mobile, web, desktop, CTV, and in-store. This becomes the scope of your attribution setup. If a surface isn’t covered, its contribution is invisible, and another surface will claim credit for the conversions it drove.
Use the table above as your starting point. If you have a long consideration cycle and upper-funnel brand investment, multi-touch attribution works only if you have sufficiently-complete coverage of all touchpoints. If you’re in the early stages of building your measurement stack, then linear attribution gives you a useful baseline before you have enough data for DDA. If you’re evaluating whether a channel is genuinely driving incremental revenue, incrementality testing gives you an answer that’s actually defensible.
Give every customer one ID, not five. Skip this and you’ll be working from a number that’s actually three or four different “customers” who are really the same person on different devices. A Customer User ID follows them across sessions and surfaces, so the credit lands on one person instead of getting split, and inflated, across every device they touch.
Every revenue event should be counted once, regardless of how many platforms claim it. That calls for an independent attribution layer with access to all touchpoints and a deduplication logic that runs before the number reaches your dashboard. It also requires data that’s current enough to be actionable, via hourly ingestion rather than day-old exports.
If your marketing attribution reports $1,000 in revenue and your finance team reports $950, don’t dismiss it as a rounding error. Reconcile it so that your marketing numbers stand up to the scrutiny of budget conversations. Common causes of discrepancy are different event definitions (what counts as revenue), different timeframes (when a conversion is recorded), and attribution lag (events you haven’t matched yet).
In attribution, drift happens: new channels get added, measurement gaps appear, and model outputs shift as data volume changes. A weekly review of your attributed revenue versus your finance-reported revenue catches problems before they compound.
Whatever platform you build your revenue attribution model on, it should be compatible with agentic optimization systems. If automated bidding tools are reading from your attribution data, the setup decisions you make now determine the quality of every automated decision down the line.
The value of revenue attribution is that it closes a gap that other attribution setups often create. Start by defining the one action that actually counts as revenue for your business: first payment, completed purchase, whatever it is. Everything downstream depends on getting that definition right, because you can’t defend a number built on the wrong event.
Cross-surface stitching comes next, joining together each touchpoint and assigning credit appropriate to the influence it had on that completed transaction.
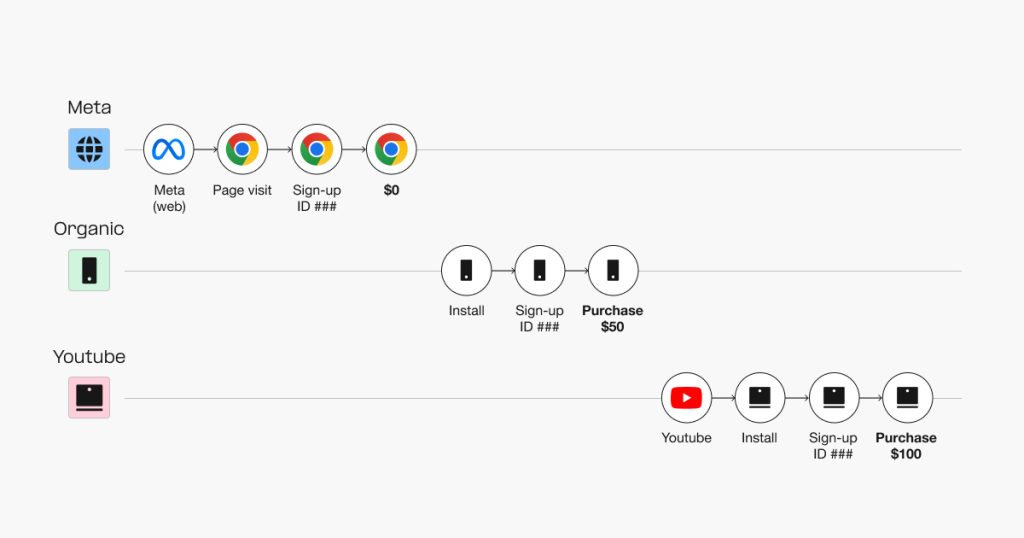
Finally, deduplication – but not after the fact. Deduplication needs to come at the identity layer, to prevent duplicates from being created in the first place.
When these three steps are in place, the revenue number from your attribution setup is the same revenue number your finance team recognizes.
We’ve walked through the hows and whys of revenue attribution in general terms, so let’s look at some real-world examples of brands across different verticals who are seeing the value of revenue attribution today.
Audio subscription platform SoundCloud was effectively running two separate analyses of its business: mobile and web. Two separate reports, two separate sets of conclusions about what was working. They adopted AppsFlyer’s cross-platform measurement and discovered a blind spot: that 1 in 10 users acquired on web went on to become active on mobile too. Under the previous setup, SoundCloud counted these as separate users.
“The value wasn’t just measuring web: it was measuring web with the same level of sophistication as mobile. Now web and mobile are one story, and that’s changed where we invest.”
Sweetgreen was splitting one customer’s revenue across two dashboards, web and app, and undercounting LTV as a result. Once they moved to unified, cross-device attribution, they reallocated budget with confidence and saw a 17% lift in marketing ROI. Their words: it brought clarity to their revenue and LTV picture.

“AppsFlyer’s holistic web and app attribution brought the missing data pieces to our revenue and LTV measurement. This allowed us to take better control of our overall marketing strategy and budget.”

Netmarble had the same problem from a different angle: players installing the same game on mobile and PC, with revenue split across two separate reports instead of one player. Unifying that view let them make budget calls based on a player’s full value, not half of it, and helped Solo Leveling: ARISE hit #1 for revenue in over 30 countries.

“The massive traffic from Solo Leveling: ARISE required stable, high-volume measurement. AppsFlyer helped us capture all the signals accurately and optimize in real time.”

Step needed a way to marry ad spend and attribution data so that they could understand which campaigns were driving the most cost-efficient bank signups. By switching MMP to AppsFlyer, they were able to optimize their CPA (cost per acquisition) more effectively. In their own words, this switch was “a game changer”.

“It gives us a clear picture of campaigns and ad sets, driving the most efficient cost per action and integrating all spend data.”

Each of the brands above faced a similar challenge: the siloed or self-reporting models they were using weren’t able to give them a true picture of customer LTV. By switching to unified revenue attribution software they were able to nail down ROAS numbers that they could trust.
Here’s how siloed or self-reporting attribution differs from a unified approach:
| Capability | Siloed / self-reporting | Unified (AppsFlyer) |
|---|---|---|
| Revenue counting | Each platform counts independently | Single deduplicated event per customer |
| Attribution model | Last-click by default | Configurable: first-touch, MTA, DDA, incrementality |
| Cross-surface revenue | Per-platform only | Mobile + web + CTV |
| Customer identity | Cookie / GAID / IDFA | CUID, consistent across platforms |
| Walled garden deduplication | No | Yes, via SSOT (single source of truth) |
| CTV revenue attribution | No | Yes |
| Incrementality testing | No | Yes |
| Real-time BI integration | Manual export / merge | Hourly, 170 fields |
| AI optimization compatibility | No | Yes |
Single source of truth (SSOT) is particularly relevant here as a major point of difference with siloed or self-reporting attribution. When a customer’s journey crosses multiple platforms, an independent SSOT layer stops your dashboards from logging paid revenue as organic or counting it twice. Instead you get the same event, counted once, with the correct source attribution.
The next question is which approach you should use to implement revenue attribution. The decision can be boiled down to buy, build, or add, and the best fit for you depends on your own circumstances:
Buy an MMP if you’re running paid campaigns across multiple networks and don’t have the engineering team to build and maintain your own identity layer. That’s most teams, and there’s no prize for building it yourself if a platform already does it well.
An MMP provides the CUID infrastructure, cross-platform deduplication, and incrementality testing that a custom setup would take months to replicate, and ongoing maintenance that most teams underestimate. When it’s time to evaluate whether your current setup is still the right one, see: How to know when it’s time to switch your MMP.
Build your own revenue attribution model if you have a mature, first-party identity graph already in production, strong data engineering resources, and measurement needs that are specific enough that an off-the-shelf platform doesn’t cover them well. But keep in mind that the ongoing cost of maintaining your own model is significant compared with having an MMP handle it.
Layer in media mix modeling (MMM) if you have significant offline or brand investment (CTV, OOH, retail promotions) that digital attribution can’t see. MMM and MMP-based attribution are complementary: MMM handles aggregated, privacy-safe measurement; attribution handles person-level, in-flight optimization. Using both and reconciling their outputs is how unified marketing measurement works in practice.
But keep in mind that no approach produces perfect numbers. Your goal should be to reduce error and increase your ability to make good budget decisions from ROAS numbers that are as trustworthy as possible.
The real test for revenue attribution is whether you can walk into a budget conversation, point to a number, and have it hold up when someone pushes back. That’s what attribution is actually for.
It’s only half the equation. True ROI depends just as much on accurate cost data, which comes with its own mess: no two networks report spend the same way, so that side is just as fragmented as the one we’ve been solving for here. Check out our guide to measuring true ROI for the full picture of what accuracy takes on both sides, and talk to us to see what unified revenue attribution looks like on your own mix of platforms.