
Reach matters: An introduction to reach-based incrementality measurement


An important task many marketers are faced with today is to determine whether their ad spend generates incremental results. In other words – out of the customers who are exposed to ads and complete an order, how many extra orders are actually the result of advertisements, and how many would have occurred regardless?
The only way to accurately answer this question is by performing an incrementality test: randomly assign users either to see ads (test group) or not (control group), and then measure the difference between the two groups over the course of the experiment.
While this sounds pretty straightforward, achieving optimal conditions for incrementality measurement can be tricky — whether it’s determining the right audience size, test duration, or even choosing the right time of year to run the experiment — as all of these factors can significantly influence your results.
But one curveball that marketing teams are less aware of when running incrementality tests revolves around (pun intended) the actual reach of their experiment.
In this first piece in our Incrementality knowledge series we’ll take a deeper look into reach-based incrementality, where we’ll share some of our insights on how it works and how it impacts bottom-line lift calculation.
Get the latest marketing news and expert insights delivered to your inbox
What is reach-based incrementality anyway?
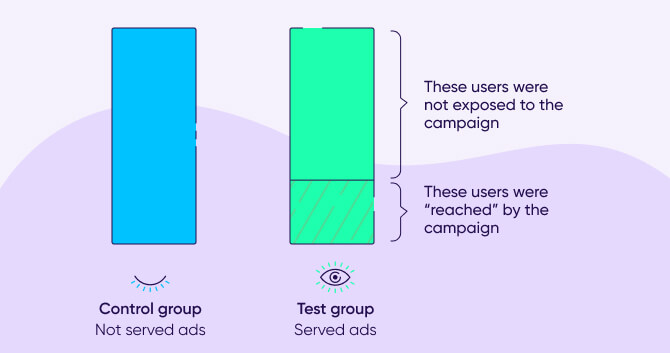
Reach-based incrementality is a methodology that takes into account the fact that not all users in the targeted group are actually exposed to ads. This can happen for various reasons, but the most common one is simply low availability of the targeted audience on the supply channel.
The result is often a much more limited ‘reached’ audience compared to the audience that was initially segmented for the campaign.
Normally, when measuring incrementality, the comparison between the test group that sees the ads and the control group that is withheld from seeing ads, will include the entire user base from each group.
This is usually referred to as the ITT (Intent-to-treat) methodology, and it’s commonly used by marketing teams given it’s easier to implement than most other methodologies.
One of the drawbacks of ITT, however, is that it assumes the entire audience has been “treated” or exposed to ads, which is rarely the case.
This often results in ‘noisy’ data impacting the results of the lift study. To better articulate the differences, let’s explore the following example:
Calculating reach-based lift
Say our experiment is targeting an audience of 1M users, of which 800K are targeted with an ad campaign (test group) and 200K are excluded from seeing it (control group).
The total number of conversions generated by the test group is 14K, which, if compared to the entire group, would generate a CVR of 1.75%

Similarly, the control group generated 3K conversions, which would result in a CVR of 1.5%

Utilizing ITT, we would have come to the conclusion that the experiment resulted in a 16.67% lift.

Now let’s apply the actual reach of the experiment and observe how it impacts our results.
When accounting for the campaign’s reach, we see that only 80K users from the original group of 800K users in the test group – were exposed to the advertising campaign.
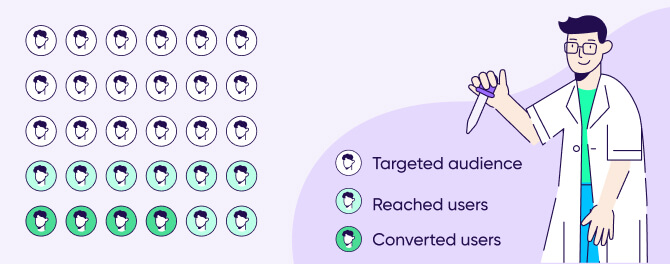
These 80K users generated a total of 10K conversions, which dramatically changes the CVR calculation:

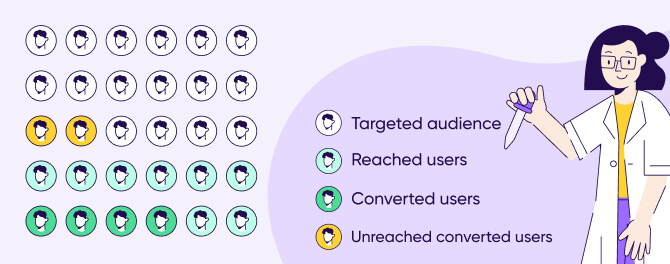
Notice that we now have 4K outstanding conversions. This means that there are users in the test group that have also generated conversions, even though they were not exposed to ads. This creates a new group of users that can be named ‘unreached converted users’.
We can now calculate the unreached user conversion rate accordingly:

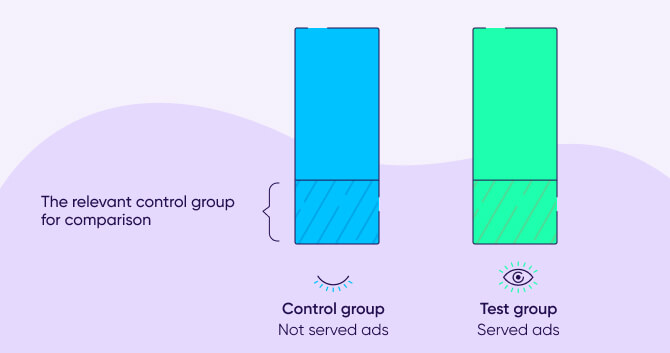
This group of users will help us in our next step of calculations, which involves establishing a comparable control group, aka the ‘counterfactual control group’.
Building the counterfactual control group
Now that we’ve figured out the real CVR of the test group, we can go ahead and apply a similar process to the control group in order to maintain an ‘apples-to-apples’ comparison.
For this example, let’s assume the control group also generated new conversions – reaching a total of 3K. Before jumping into the calculations of the actual CVR, we first need to understand what a counterfactual control group is.
The underlying guideline here is that the control group is statistically identical to the test group, which means we can apply the same findings from the test group on the control group as well.
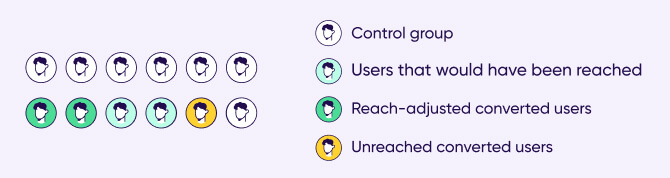
Starting with the reached users – since the reach of the control group is not something that we can observe, we have to approximate it according to a similar group. This approximation is what creates the counterfactual control group.
In order to create this group of users, we need to ask ourselves – “had the control group been targeted – what would have been its reach?”. The answer would be the same reach as the test group’s, since the two groups are statistically identical.
This means that out of the 200K users in the control group, only 10% will be considered as reached users – since it is identical to the test group reach.

Remember that in the test group we had users that converted even though they were not exposed to ads. A similar adjustment also needs to be carried out for the control group under the same previous assumption of “what would have happened had the control group been targeted?”.
Applying the test group’s unreached CVR of 0.56% allows us to calculate the same metric for the control group:


The next step would be to calculate the control group’s reach-adjusted conversions.
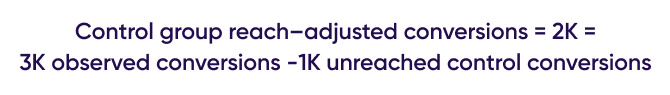
The overall observed conversions by the control group was 3K, of which we assume 1K were generated by a counterfactual unreached group of users.
Therefore, the counterfactual reach-adjusted control group generated 2K conversions.
We are now finally able to calculate our counterfactual control group’s conversions rate:

As we now have an apples-to-apples comparison of the conversion rate of the test and control group, we can calculate the experiment’s lift:

Summary
The conclusion is clear – when the information about which users have been exposed to ads is available, it can be used to more accurately calculate incrementality, and in most cases, will significantly increase the incremental results our experiment yields.
Compared to the 16.67% lift calculated, without taking reach into account, we were able to achieve a 50% higher lift in our reach-adjusted experiment!
Accounting for reach gave us a much more accurate view and understanding of the experiment’s lift, and we believe that applying this method will become the new standard for lift calculations in mobile marketing.
Before you go ahead and implement this method, we encourage you to first fully understand the concept of incrementality testing, and make sure you have the right tools and knowledge in place in order to make more informed decisions about your marketing campaigns.
In our next Incrementality knowledge series piece we’ll discuss the various pitfalls marketers face when initiating an incrementality experiment and how to avoid them.