
5 challenges to consider when measuring the incremental lift of your remarketing campaigns


In part I of our incrementality series, we covered the complexities of measuring incremental lift and the true impact of your remarketing activity.
By testing different influencing factors, advertisers can gain true insight into the value of their remarketing dollars. This is done primarily through very carefully crafted A/B tests.
A/B testing is not only a scientific notion but has also become a vital tool for digital marketers in the 21st century. It is one of the most powerful ways to gain a competitive advantage and priceless learning from your remarketing activity.
Though insights gained from a successful A/B test are a strategic way for marketers to make informed budgeting and optimization decisions, they can also put them at risk of costly miscalculations if carried out inaccurately.
When it comes to A/B testing for incremental lift, getting the process right is critical. For starters, we recommend using an intuitive tool such as AppsFlyer’s Audiences to ensure success rather than building an A/B test from scratch. In addition, we are thrilled to announce AppsFlyer’s Incrementality solution.
The complexities of data management are hard to comb through and can potentially drain your resources and budget. To get started, consider the below points based on our extensive experience working with top brands across all verticals.
1. Creating test and control groups devoid of “noise”
In today’s ecosystem, each one of your customers is subject to many marketing signals that impact his or her user behavior.
This can include in-app messaging, push notifications, emails, offline and online marketing messages, to name a few.
The challenge arises once you want to specifically measure the impact of one re-engagement campaign on top of an already existing program. In order to do so, you need to make sure that both the test and the control environments are not cluttered with external influencers tainting your test group (or, alternatively, that both are influenced evenly by the same exact factors… more on that later).
Generally, marketers can’t stop-play their entire program to test just one factor and its impact alone.
So, what are they to do?
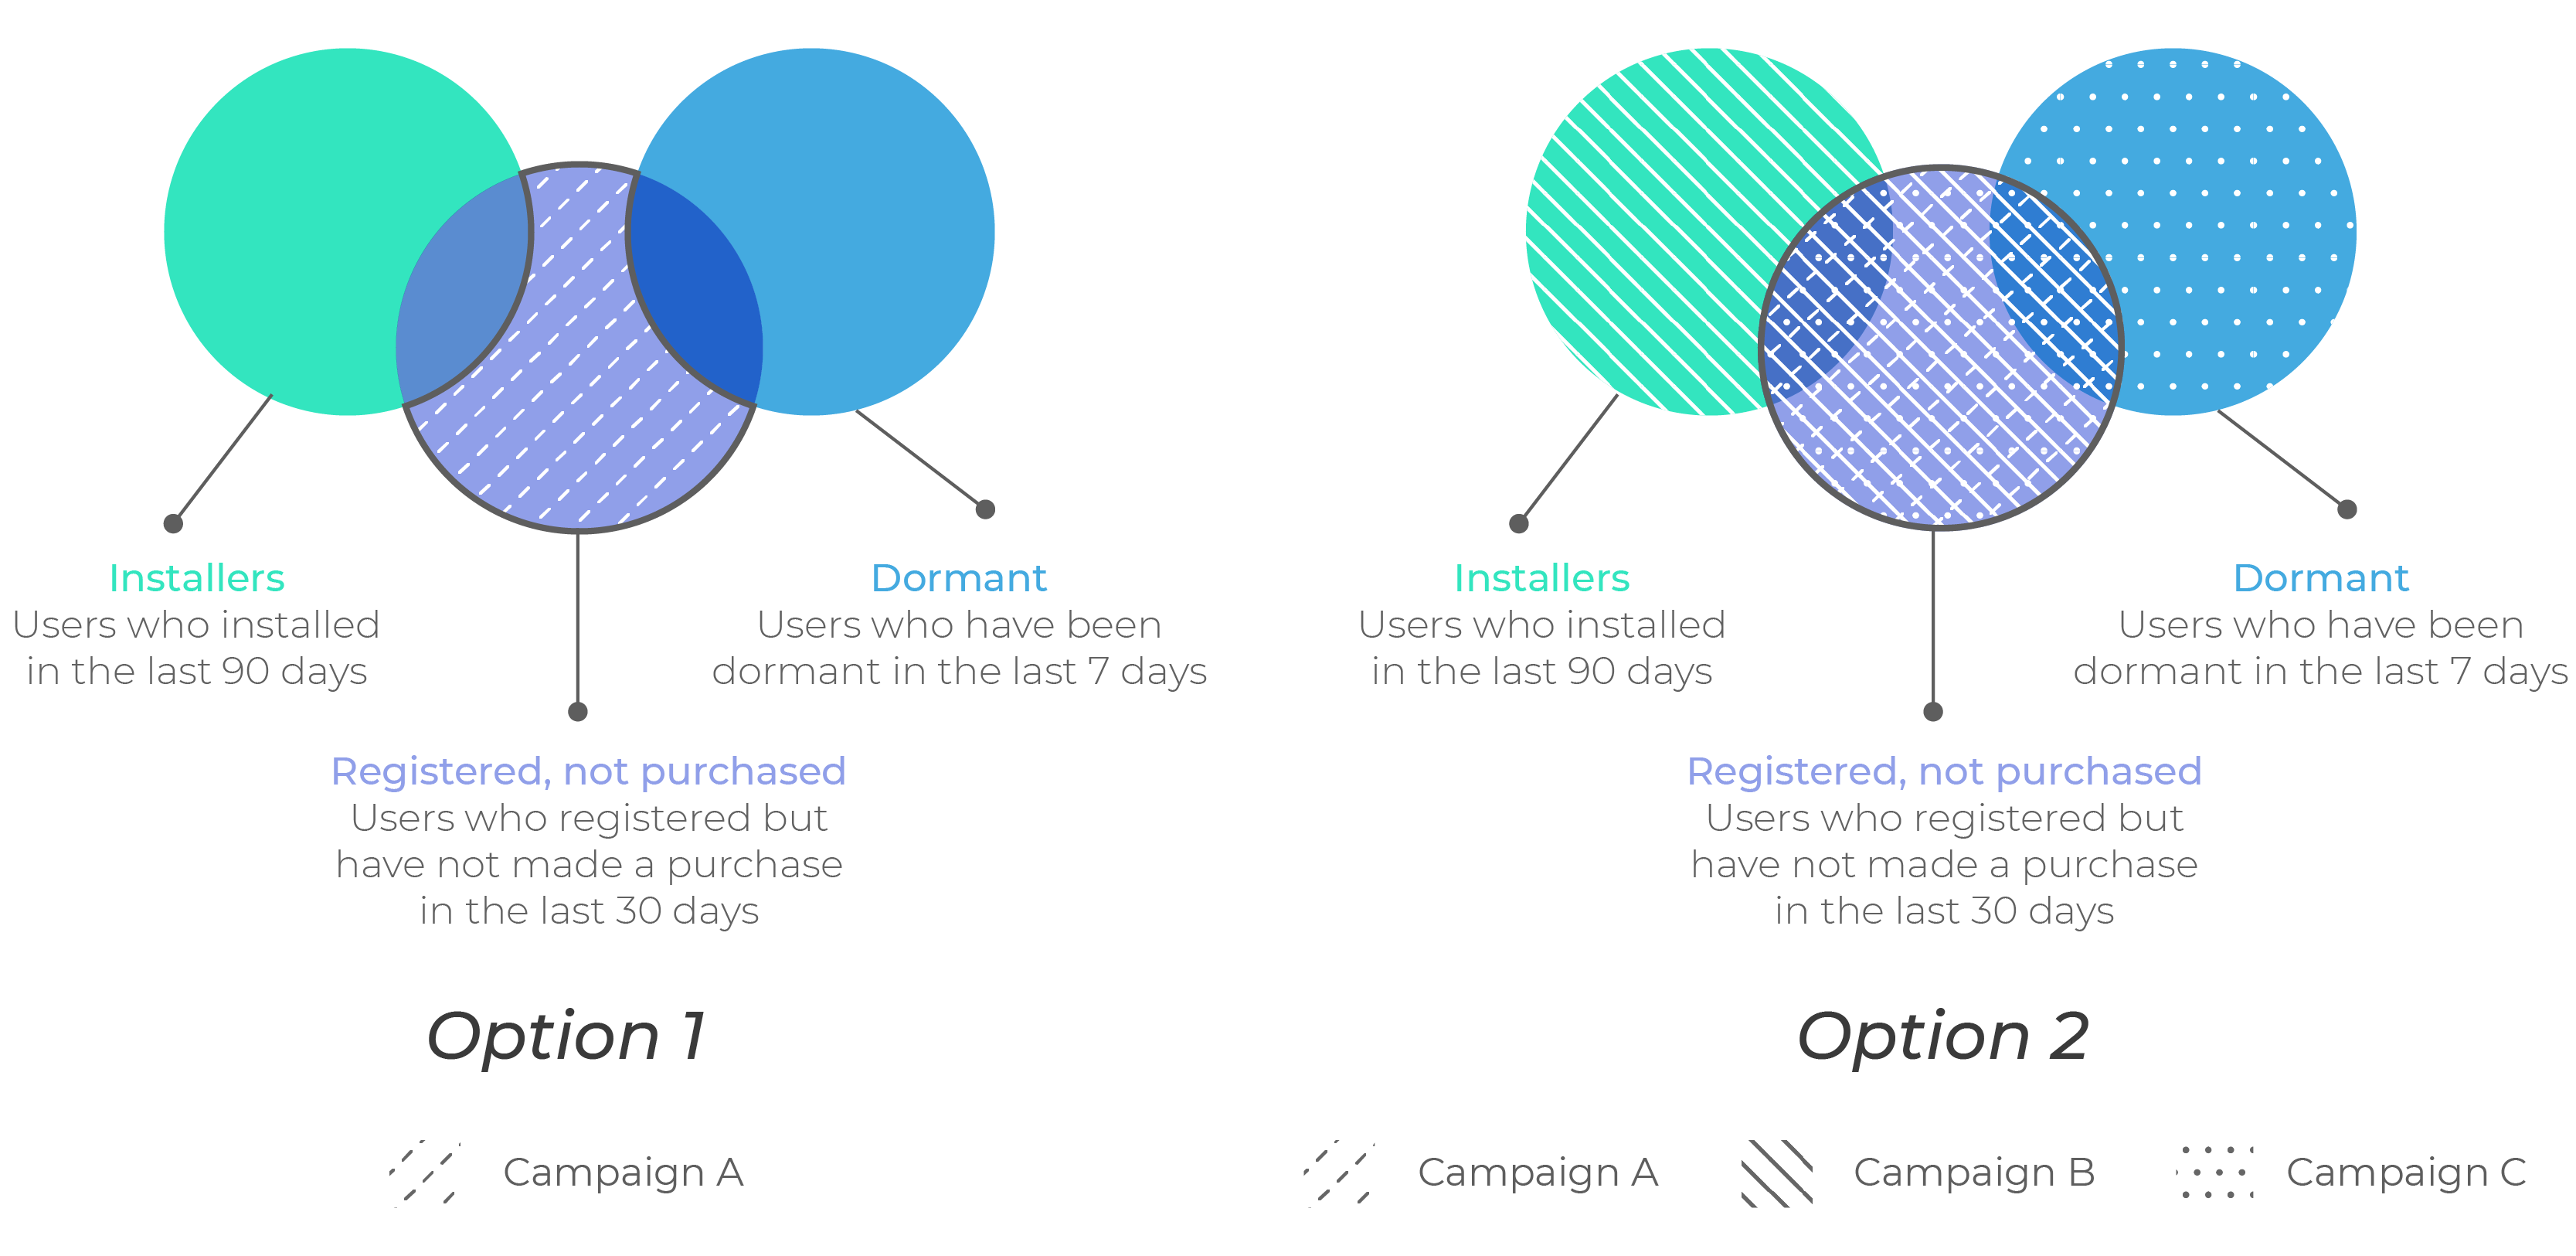
Say an eCommerce brand identified an audience for their test (people who registered but didn’t purchase in the last 30 days). This audience will be exposed to a remarketing campaign on Facebook (A).
Using AppsFlyer Audience’s Venn diagram, the eCommerce brand saw that the audience selected also overlaps with two other audience segments that are currently being targeted in other remarketing campaigns:
- B (targeting users who Installed in the last 90 days)
- C (targeting users who were dormant in the last 7 days)
Let’s focus on the two potential options below:
Exclude overlapping audiences
Option 1:
The brand can exclude users who exist in other audiences connected to remarketing campaigns (B and C) from their target test group A (Facebook remarketing campaign).
That way they ensure that both test &control groups are excluded from all other remarketing campaigns running in conjunction at this time.
Include test audience in overlapping audiences
Option 2:
Alternatively, they can make sure that the test &control audience used for the test on Facebook (A) will also be targeted by the same two remarketing campaigns (B+C).
In this scenario, the eCommerce brand could attribute the lift to the Facebook remarketing campaign, assuming that the results yielded a lift.
With AppsFlyer’s split testing feature, you can create two or more randomized groups (test and control) at a click of a button; and by using AppsFlyer’s Venn diagram for visualization, you can see the overlap of your target audiences.
This will help you create an ideal test scenario in no time!
2. Deciding on the optimal audience volume and duration for your experiment
For each business, the volume of users differs. It is thus difficult to agree on which segment size would be best to test for optimal results and whether those results are statistically significant enough for further analysis.
There is an important tradeoff between how confident you would be with the test results and the high cost of maintaining a lengthy test period.
Remember, marketers need to identify an audience segment that is qualified for remarketing. If the target group is refined to the point where it is very small, then keep in mind that the control group will be even smaller, rending the results insignificant.
If the daily volume of app users is limited, the duration of the test must be longer in order to capture more and more engagement, and best understand the average user behavior.
How much time needs to pass for the incremental test to result any meaningful insights? Would a daily comparison do?
Not likely… as the user funnel lengthens and the touchpoints broaden it may take more time to understand the full picture.
For some business cases, conversions may trickle in after the end of the campaign. This changes the amount of users that may now qualify as conversions over time. Therefore, longer test periods may be necessary depending on the nature and time it takes for those users to fully convert.
To provide a good indication on the ideal volume and length for your test, you can measure the performance of your audience before the start of the test to understand the current behaviour of your audience in a pretest state. This baseline together with your expectations of the lift by the test campaign could help you estimate what conversion volume will be needed to make the test statistically significant.
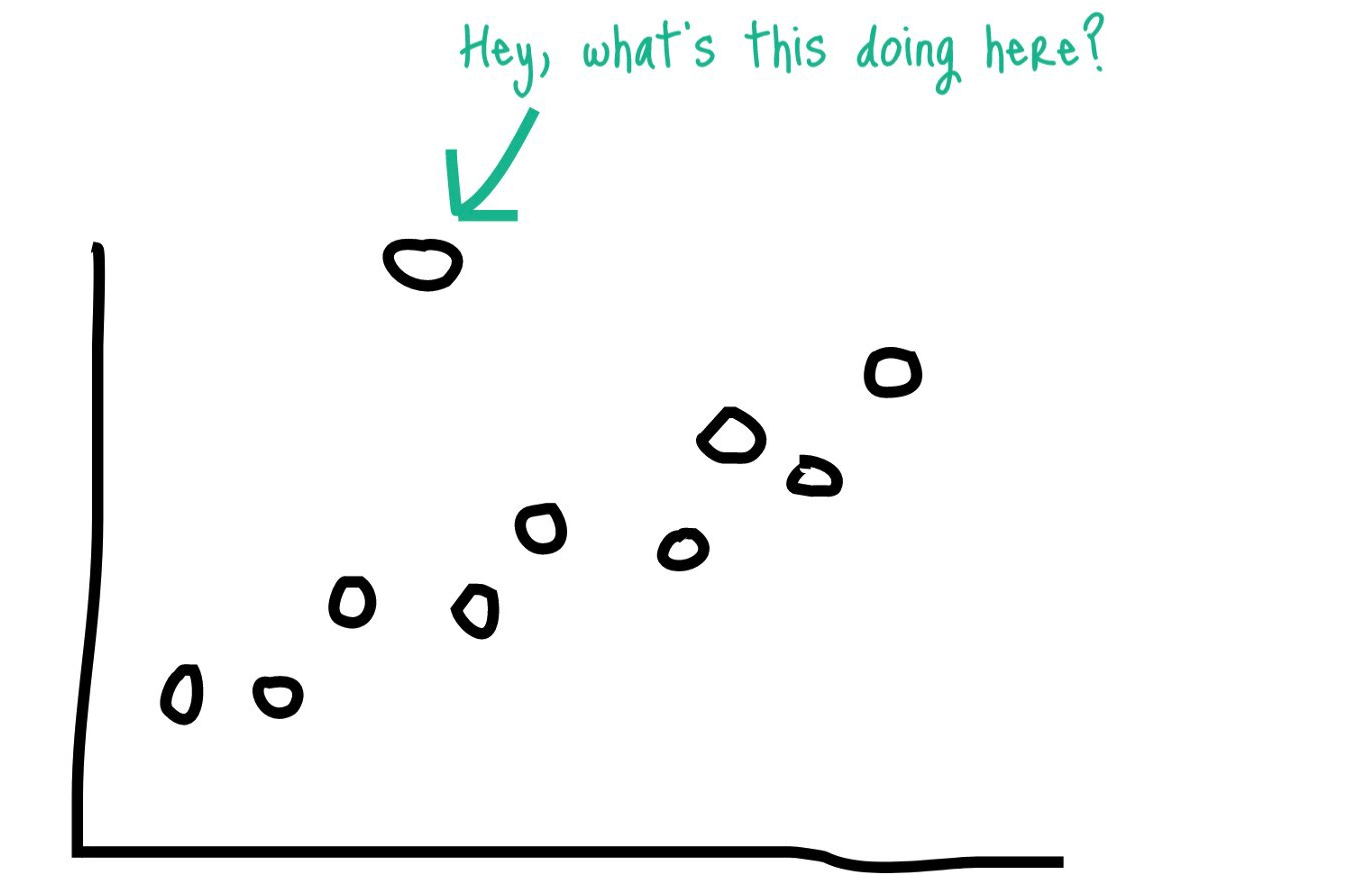
3. Excluding outliers
There will always be outliers in your data, and it’s important to detect and understand how to deal with them using the right method based on your KPIs. These edge cases can render misleading numbers that can cause incorrect calculation of your test results.
As mentioned above, volume is also important when considering what to do with outliers in your data. The larger your audience pool is, the less impactful your outliers are.
Think about it, if you had one individual that made a purchase of $1,000 the average revenue per user will be impacted more if you are looking at 20 purchases alone vs. 2,000 purchases.
Though it is common to exclude top and bottom outliers from your data, is not always the right thing to do.
For example, if your KPI is revenue per user, you cannot exclude the bottom 5% of your data because those ‘outliers’ include users who did not make a purchase vs. those who made a purchase: ($100 + $0)/2 users vs, ($100)/1 user.
Another thing to note, you may need to choose the right method to “normalize” your data according to your KPI.
One example is using an average of averages approach in order to eliminate the inflation caused by high volume segments. When simply calculating your result’s average, you are not taking into account the impact of the size or volume of your segment.
Let’s say we only have purchase orders in two states, New York and Pennsylvania.
The total order amount in NY is $1,000 for 10 orders and $100 for 2 orders in PA.
With an average calculation, the average purchase order is $1100/12 = $91.67.
This means that NY influenced the results here due to the higher-order volume and purchase amount. Therefore, this is not a good representative example of PA average order amount.
With an average of averages ($1000/10 +$100/2)/2 = $75, which is a $16 difference from the averaged calculation above.
Having the right method to deal with edge cases in your data can have a serious impact on the calculation of your test results.
That’s why there is no “one method fits all” but rather a carefully crafted calculation based on each brand’s business model.
4. Pay attention to seasonality
Choosing the right time to start running your test is crucial.
When you’re looking at your KPIs, take into consideration the normal trends of behavior for your users.
One example that comes to mind is if you decided to launch your test around the holiday season, particularly when it falls on Black Friday and Cyber Monday.
The results of your campaign will output a larger lift than the control group in this case because it’s not the right indicator of how the campaign would have performed had there not been any special events during that time. Keep in mind other major events or market trends happening when you want to run a test to prevent shifting the data unnecessarily.
Get the latest marketing news and expert insights delivered to your inbox
5. Establishing the right process to ingest and review the data from your test
All of your efforts could go to waste if you are not able to analyze the results properly and better yet, take immediate action. Properly analyzing and reporting on your test results is a long and expensive process and can really drain your resources (particularly for your data team).
Since some networks provide partial raw data or none at all, AppsFlyer closes the gap by providing an easy way to ingest the raw data you need to make informed decisions.
And we don’t stop there. Given AppsFlyer’s extensive experience in data visualization, we are working on providing some powerful visuals for your A/B testing and reporting needs.
Final words
Leading companies will agree on the importance of a test and learn mindset.
With remarketing budgets growing and advertisers experimenting with different placements, networks and ad formats, understanding the true impact of your remarketing efforts is crucial in making budgeting decisions and justifying scale.
More and more brands are developing testing methods to optimize their marketing program, and AppsFlyer is keeping up with the demand to provide high-end solutions for advanced marketing needs.