How many media partners do app marketers actually use?


You’ve probably all heard about the AppsFlyer Performance Index — the industry-standard report card on the performance of mobile media sources. Last week, we released Edition V and the pick up has been amazing.
The index is all about providing insights on specific media sources. To complement that, we’re launching a new blog series called Media Deep Dive, where we’ll be offering data-driven insights on the media side of the business, but from other angles.
Part I – How many media partners are used by different apps in different categories?
The mobile marketing ecosystem is vast. App marketers have thousands of options to choose from. How many do they end up using? Is there a right number? And how do the numbers differ when looking at different groups of apps (based on spend), across different verticals and different platforms?
To answer these questions, we looked at over 1,100 apps that partnered with about 900 media sources that delivered at least 1,000 paid installs for a single app throughout September 2017.
Here’s what we found.
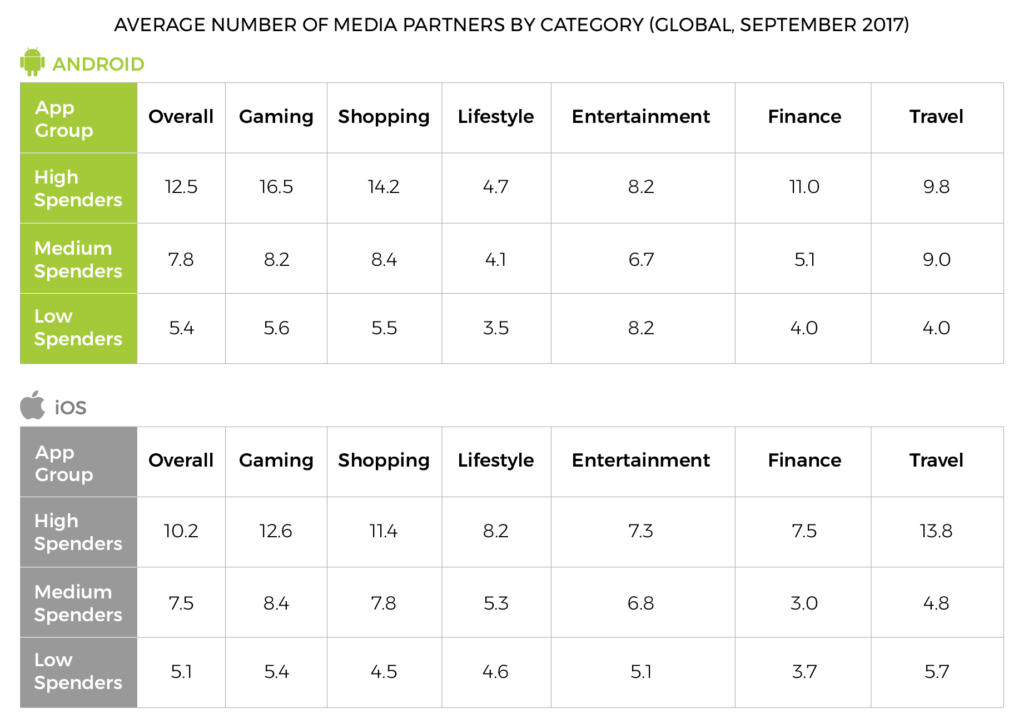
What insights can we gather from these tables?
Spend and network usage are highly correlated
First thing that’s clear right off the bat – the greater the spend, the more media sources are used. It’s all about available resources – in actual ad spend budget and team size.
Dividing a small budget among many partners is not recommended because media buying engines may not be able to optimize properly with insufficient scale. There is also an operational cost that goes with every campaign, and media networks always seek to maximize their profit. Knowing this, networks usually set a minimum spend requirement.
But even if smaller apps were to partner with multiple media sources, an often single full or part time employee running campaigns would not be able to handle the oversight.
Last but not least, don’t forget that you get what you pay for as far as service is concerned. The reality is that if you put in a small budget, you will be treated accordingly.
As a result of these limitations, smaller advertisers usually run with the relatively easy-to-use self-service media sources like Facebook, Google and Twitter. When they (hopefully!) scale up, more resources become available to them and they can begin testing more partners. In parallel, they would be able to gradually build a team that would be able to work with a larger pool of media sources, and help optimize the potential of each partner.
The value of media diversification
Beyond the availability of resources, savvy marketers understand that to succeed in a highly competitive space, every cent counts. And when one works with numerous media sources, there’s far more flexibility to work with. That opens up much more room for optimization while playing with different levers at different levels: increase/decrease spend, negotiate terms, drive more scale, change GEOs, etc. etc.
Also, marketers seek to target the same users multiple times but in different mindsets, across different platforms, displaying different ad types that offer different experiences. Sometimes a banner won’t do the trick, but a rewarded video would, and other times a social or search context is what’s needed to engage a user.
Even if some networks offer far more granular targeting, it’s nonetheless important to target the same users at different scenarios. So if a network offers a different experience, but perhaps its targeting is not as granular, it would still make sense to at least test that network. The more media sources you work with — particularly those that offer different experiences — the greater the ability to create meaningful interactions.
Android user base impacts network usage among high spenders
Overall, the data shows that there are minor differences among low and medium spenders across iOS and Android. However, when it comes to high spenders, the fact that the Android user base is much larger than the iOS base becomes significant, as the former runs with nearly 25% more media partners than the latter in order to drive the needed scale.
The only verticals where high spenders use more media sources on iOS are lifestyle and travel — categories with a larger relevant user base in iOS.
Next up in our Media Deep Dive blog series, we’ll answer the following question: What is the distribution of spend with media partners among different app groups? Stay tuned!
Part II: Network testing for success
Like good soundmen, app marketers should add the call “Testing, Testing 1,2,3!” to their repertoire. After all, constantly testing new media sources to increase reach and improve performance is a key component in the app marketing checklist.
In our previous Media Deep Dive blog, we looked at the average number of networks used by apps based on their level of ad spend. This time, we segmented apps by the number of non-organic installs over an 18 month period in an attempt to understand the prevalence and success rate of test campaigns.
What did we find?
- 43% of test campaigns are successful; all you need are a few wins to drive growth
- Test campaign success is distributed across many media sources, with over 50% of media sources delivering a success rate above 40%
- Testing is common: for every app, over 30% of campaigns are test campaigns
Adopting an ‘always be testing’ mindset
In today’s fast-paced and hyper-dynamic mobile advertising space, remaining static is ranked high on the list of worst things a marketing manager can do. You always need to be thinking: How can I improve my reach? How can I lower my costs and increase my revenue? Often, the answer demands a fair amount of testing.
Turning the levers up and down, or even off, is an integral part of the job. If your media partners know they are being tested they will try harder, whether it’s on an ongoing basis or as part of a more significant incrementality test or head-to-head test vs. another network. After all, churn is a significant pain for media companies so they will go the extra mile to keep your business.
Testing usually comes with lower media costs, so there’s less to lose and much to gain. As marketers introduce new players into their marketing mix, often competing for the same budgets, vendors are pushed to deliver more advertiser-friendly pricing.
It is no wonder that in some companies, testing is entrenched in policy. It’s part of a company’s culture, and it usually demonstrates a healthy attitude towards business overall.
How did we define test campaigns in our analysis? We know that testing means different things for different advertisers and there’s definitely not a single source of truth. Having said that, we applied the following conditions:
- Media sources that did not generate any installs for a specific app for at least six consecutive months during an 18-month period
- Media sources that had at least three months of data for the app in question
- A threshold of at least three networks per app and 500 monthly installs per media source per app was enforced
Insight #1: 43% of test campaigns are successful
According to our data, a sufficient amount of test campaigns are successful at the very least to warrant further investigation. We labeled test campaigns as successful if they had at least three months worth of data and their traffic had increased for at least two consecutive months after the test began.

- We can see that for most apps, the success rate is between 41% and 60%, with the 21%-40% range not far behind
- Almost 1 in 4 large apps have an impressive 61%-80% test success rate
Ultimately, all you need are a few successful tests. And when you scale these campaigns, that’s where you can achieve growth. The more you test, the greater your chance of finding aces for your app.
The fact that testing is largely successful means it’s worth the effort, but it does require resources – both time and funding — depending on your app’s size.
From a technical standpoint, testing is easier if you work with an attribution provider since all you have to do is set up attribution links and enable relevant postbacks. In minutes, you should be up and running.
Beyond measurement, larger apps have broader manpower and financial resources. They are often savvier advertisers with plenty of experience setting up tests — pinpointing creatives, targeting the best audiences and allocating the right budget — and closely measuring them. However, getting things through legal and finance can be a hassle. For smaller apps, the opposite is true: setup is harder, while legal and finance restrictions are lighter.
Insight #2: Success is distributed across many media sources.
In order to demonstrate that the app success rate shown above is not limited to a small number of media sources, we examined share at the media level and found the following:
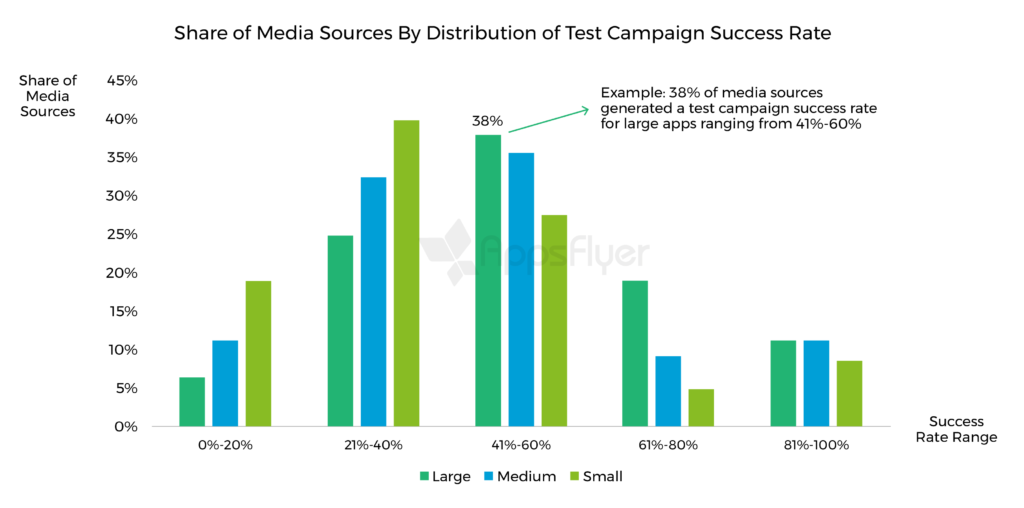
- Overall, over 50% of media sources delivered a success rate exceeding 40%
- The largest concentration of media sources running successful tests for their clients was found between the 21% and 60% success rates
- Among large apps, almost 1 in 5 media sources delivered an impressive 61-80% success rate
Insight #3: Over 30% of the average app’s campaigns are test campaigns.
With many successful tests proving to be a success, it is no wonder we’ve found that testing is quite common. Let’s take a look at the numbers:

- We can see that across the board, app marketers understand the importance of testing: over 30% of media sources on average are in a testing phase, and their share is relatively similar across different app sizes
- The larger the app, the higher its number of test campaigns: large apps run 2x and 4x more tests than medium and small apps, respectively; this is largely due to resource availability
Things You Should Know Before Testing
Research. Read, investigate, ask peers, join a community. There are many experienced, knowledgeable, and friendly marketers out there so don’t be shy. Also, check out industry reports on media networks like our very own AppsFlyer Performance Index,which has been steering marketers in the right direction since 2015.
Get key info from media partners. Are they self serve or managed? Is their inventory direct or non-direct? What is the level of transparency offered? How much of their inventory is “exclusive”? Which ad formats do they offer (make sure you see an actual preview, not just the design specs)?
Clearly define legal terms. It is highly recommended to include an opt-out clause in the contract where it is clearly stated when and under which terms a test can end. In addition, make sure the type of inventory offered in the campaign is included (direct, non-direct).
Define data-driven goals for success. Set a minimum sample size and consider working with a clean variant to isolate noise. For example, run your test in a single country so you can get conclusive results faster. Whether you have short term goals (retention, or early funnel events like log-in, tutorial completion, flight search etc.), or longer term goals (monetization), make sure success is based on data from a trusted attribution provider. Lastly, ensure the time frame given to the media source to reach the goals is well defined.
In short, ‘always be testing, 1, 2, 3’ to find your optimal sound for the best performance.