
Uncovering conversion path trends across web and mobile


When user journeys spread across multiple platforms, devices, and channels, it can be tricky to discern what typical conversion paths look like.
Answering questions like “how many times is the customer interacting with my brand before downloading the app?” or, “how long does it take the user to finally sign up for a subscription?” can be key to optimizing your funnel.
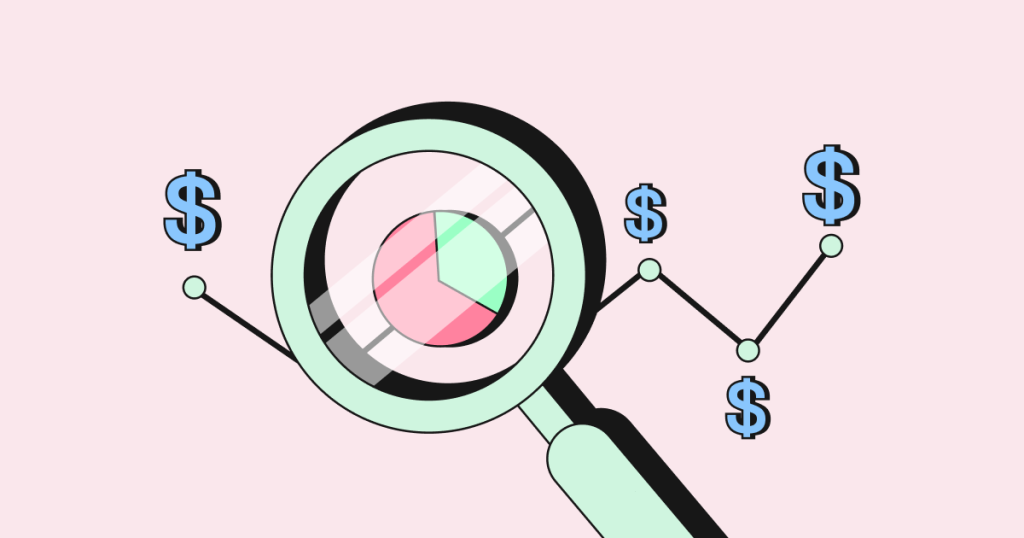
Looking to data for answers
To help marketers tackle these critical questions and enable smarter, data-driven decisions, we analyzed 68.2 million conversion paths across two weeks in May and June 2020.
The conversion paths cover user journeys across both web and app, across devices, platforms and channels. The data spans almost every mobile industry, with users from all over the globe.
We focused on two types of conversion events: app installs and web conversions, where web conversions include actions that visitors take on the brand’s website (such as registrations, purchases and subscriptions). Our analysis explored how many unique interactions (steps) users had with a brand before converting, and how long, on average, it took users to convert.
Quick to download, not so quick to convert on the web
Our data uncovered that users convert quite quickly, on average, on mobile.
Between the first interaction and installing the app, the average user engaged with the brand 1.3 times (this can include social media, ads, emails, or any other marketing channel), and took about 1.7 days before finally deciding to install the app.
Since installing an app requires a rather minimal level of commitment, this isn’t surprising.
Web conversions, on the other hand, take more consideration and thought.
Users interacted with the brand an average of 3.7 times before finally converting on the brand’s website, and this took an average of 4.2 days.
Guide
Show me the money! Your definitive guide to app conversions
Food & Drink apps have the longest paths to conversion
Some decisions are easier to make than others.
We’ve already mentioned that conversion paths are typically longer for web events than mobile installs, but even within the realm of web conversions there’s quite the range.
For example, the average user of a Food & Drink brand will take up to 8.9 days to convert on the web (make an order, sign up for a service, etc).
Making the decision to install a Food & Drink app, however, will take less than 2 days, on average.
Organic traffic might be your most significant marketing channel
One of the biggest puzzles marketers face with user journeys is understanding how different media channels interact to drive a conversion. Some channels may be stronger for a first touch interaction, whereas others may be good BoFu catalysts.
Based on our data of both mobile installs and web conversion events, organic web search was the most significant channel for driving conversions, followed closely by direct web traffic.
- Organic web searches were the driving force behind 40% of all first interactions with the brand, and 36% of all last touches (before a conversion).
- Direct web traffic (such as a user typing “www.appsflyer.com” into their web browser), indicates a pre-existing familiarity with the brand, and accounts for 31.7% of the first touch interactions and almost 37% of the last touch.
- Social media, ads and referrals had similar impact both at the beginning and end of the funnel, whereas email campaigns had a marginally stronger impact as a last touchpoint.
One in three web conversions is happening on mobile
While the term “web” may be strongly associated with desktops, data shows that mobile web should not be ignored.
Of all the web conversion events measured, one-third were performed on mobile web (such as Chrome or Safari for mobile).
Desktop is still king for web interactions, proving as an important marketing property even for mobile-first or mobile-centric brands.
Brands that have a strong web presence or are optimizing for a web conversion (such as a subscription via the website), should ensure that their website is optimized for mobile, creating a seamless experience for users on all devices.
Almost 40% of revenue is generated on conversion day
Focusing on revenue-generating events, we did a deep-dive into web conversions to get a better idea of user behavior.
Unsurprisingly, more than a third of the revenue (37.5%) is generated on conversion day.
That’s the day the user orders the pizza, buys the shoes, or subscribes to the streaming service.
Over 65% of revenue is generated by users in the first 3 days of converting, the number steadily dropping to about 1.1% on Day 9. Days 10-30 account for about one-tenth of the revenue generated after conversion.
Get the latest marketing news and expert insights delivered to your inbox
Uncovering your own insights
The user journey can look vastly different from brand to brand, even within the same industry or similar business models. Brands working with AppsFlyer and People-Based Attribution have learned more about their users and user behavior across devices, channels and platforms.