
The organic uplift in-app marketing: Separating fact from fiction


The organic multiplier is a key data point for app marketers, yet it remains elusive.
Several years ago, we explored our vast trove of data to understand whether a number can be determined for this mysterious benchmark. After a significant deep dive into the data (you have no idea!), we concluded that it was not possible to release a number that would be statistically valid due to extreme variance.
Based on multiple conversations with marketers, we wrote that the “Organic multiplier has decreased significantly in the past couple of years.” Since then, we believe the trend has largely continued on the same, or even accelerated, trajectory.
What does this mean for the industry, and how can you factor your uplift to improve the measurement of your campaigns? To get the know-how, we’ve interviewed two mobile experts with extensive experience leading user acquisition at top non-gaming and gaming apps, respectively: Thomas Petit (@thomasbcn) and Matej Lancaric (Superscale).
You can also check out this MAMA Board from our very own David Llewllyn with more about this trend:
The organic multiplier: what it is, why it’s happening, and why it’s important
The “organic multiplier,” or “organic uplift,” is a value representing the observed correlation between organic and non-organic installs. It is a fundamental concept in user acquisition (UA), measuring how many additional organic users will install the app as a result of paid activity.
Sometimes assimilated to a full reflection of virality (k-factor), the concept partially overlaps but isn’t exactly the same thing, as you will see ahead.
For example, the increase in the organic baseline (represented in green below) can be attributed to non-organic activity (in blue):

There are a number of reasons that lead to this effect, including:
- “Hidden” virality, or word-of mouth. Not all apps have referral programs in place, and not all users will engage with them. Instead, they will directly tell their friends about your app, which is great, but also means there’s no measurement (this is what you are measuring with k-factor!)
- Driving paid traffic will propel your app up the app stores’ charts, while potentially impacting your search rankings and positioning among similar apps. One could argue that the impact of App Store Optimization (ASO) is not solely dependent on your ASO actions, but also on the organic uplift, and they would be right: it’s a bit of both, rendering the line between the “organic baseline” and its uplift even foggier.
- Incomplete measurement?
- Not all paid activity can be directly measured. Mobile link recording still doesn’t work with channels such as TV or OOH (out of home: billboards, metro ads, etc.). Some online channels bury or disallow links, leaving users to research the mentioned app on their own. While this activity generates ad spend, its impact is partly or completely hidden in organic activity, but needs to be accounted for to fully grasp UA performance. See more about this topic in the tips section below.
- User behavior doesn’t necessarily follow designed paths…

Here’s what it means on mobile:

The impact of your paid campaigns consists of what is measured through links or view-through attribution, in addition to an organic component that’s harder to measure. As such, understanding your direct return on ad spend (ROAS) based solely on the former offers a partial view of UA efficiency.
Factoring the organic uplift, and comparing paid ROI (Return on Investment = measured revenue / ad spend) to blended ROI (overall revenue including all organic/ad spend) offers a more complete view of the true effectiveness of ad spend and UA performance.
It’s important to take the multiplier into account as you model predictions, set targets that make sense for your business, and build your growth plan for optimal impact.
Lastly, there is also some confusion about the difference between incrementality and organic uplift.
It’s practically the same thing – incrementality allows you to understand the connection between your marketing campaigns and the total growth of your product – just like the organic uplift.
To be even more precise, incrementality above 100% = organic uplift.
Guide
Finding your true north: Measuring your app marketing’s true ROI
The organic multiplier is decreasing over time: the share of organic installs in the average app dropped 20% since 2016
As mentioned above, the organic multiplier effect has slowed down over the years. In the early 2010s, the entire industry was based on it – think about the burst campaigns business where you could “buy incentivized traffic, get real users!”
A significant decrease in uplift rendered this business unprofitable.
The decrease has largely continued, if not accelerated, according to the latest AppsFlyer data, seen in the chart below.
Organic app discovery in both Google Play and the App Store has gotten worse due to increased competition and the fact that more space has been given to ads and featured content placements at the expense of organic placements.
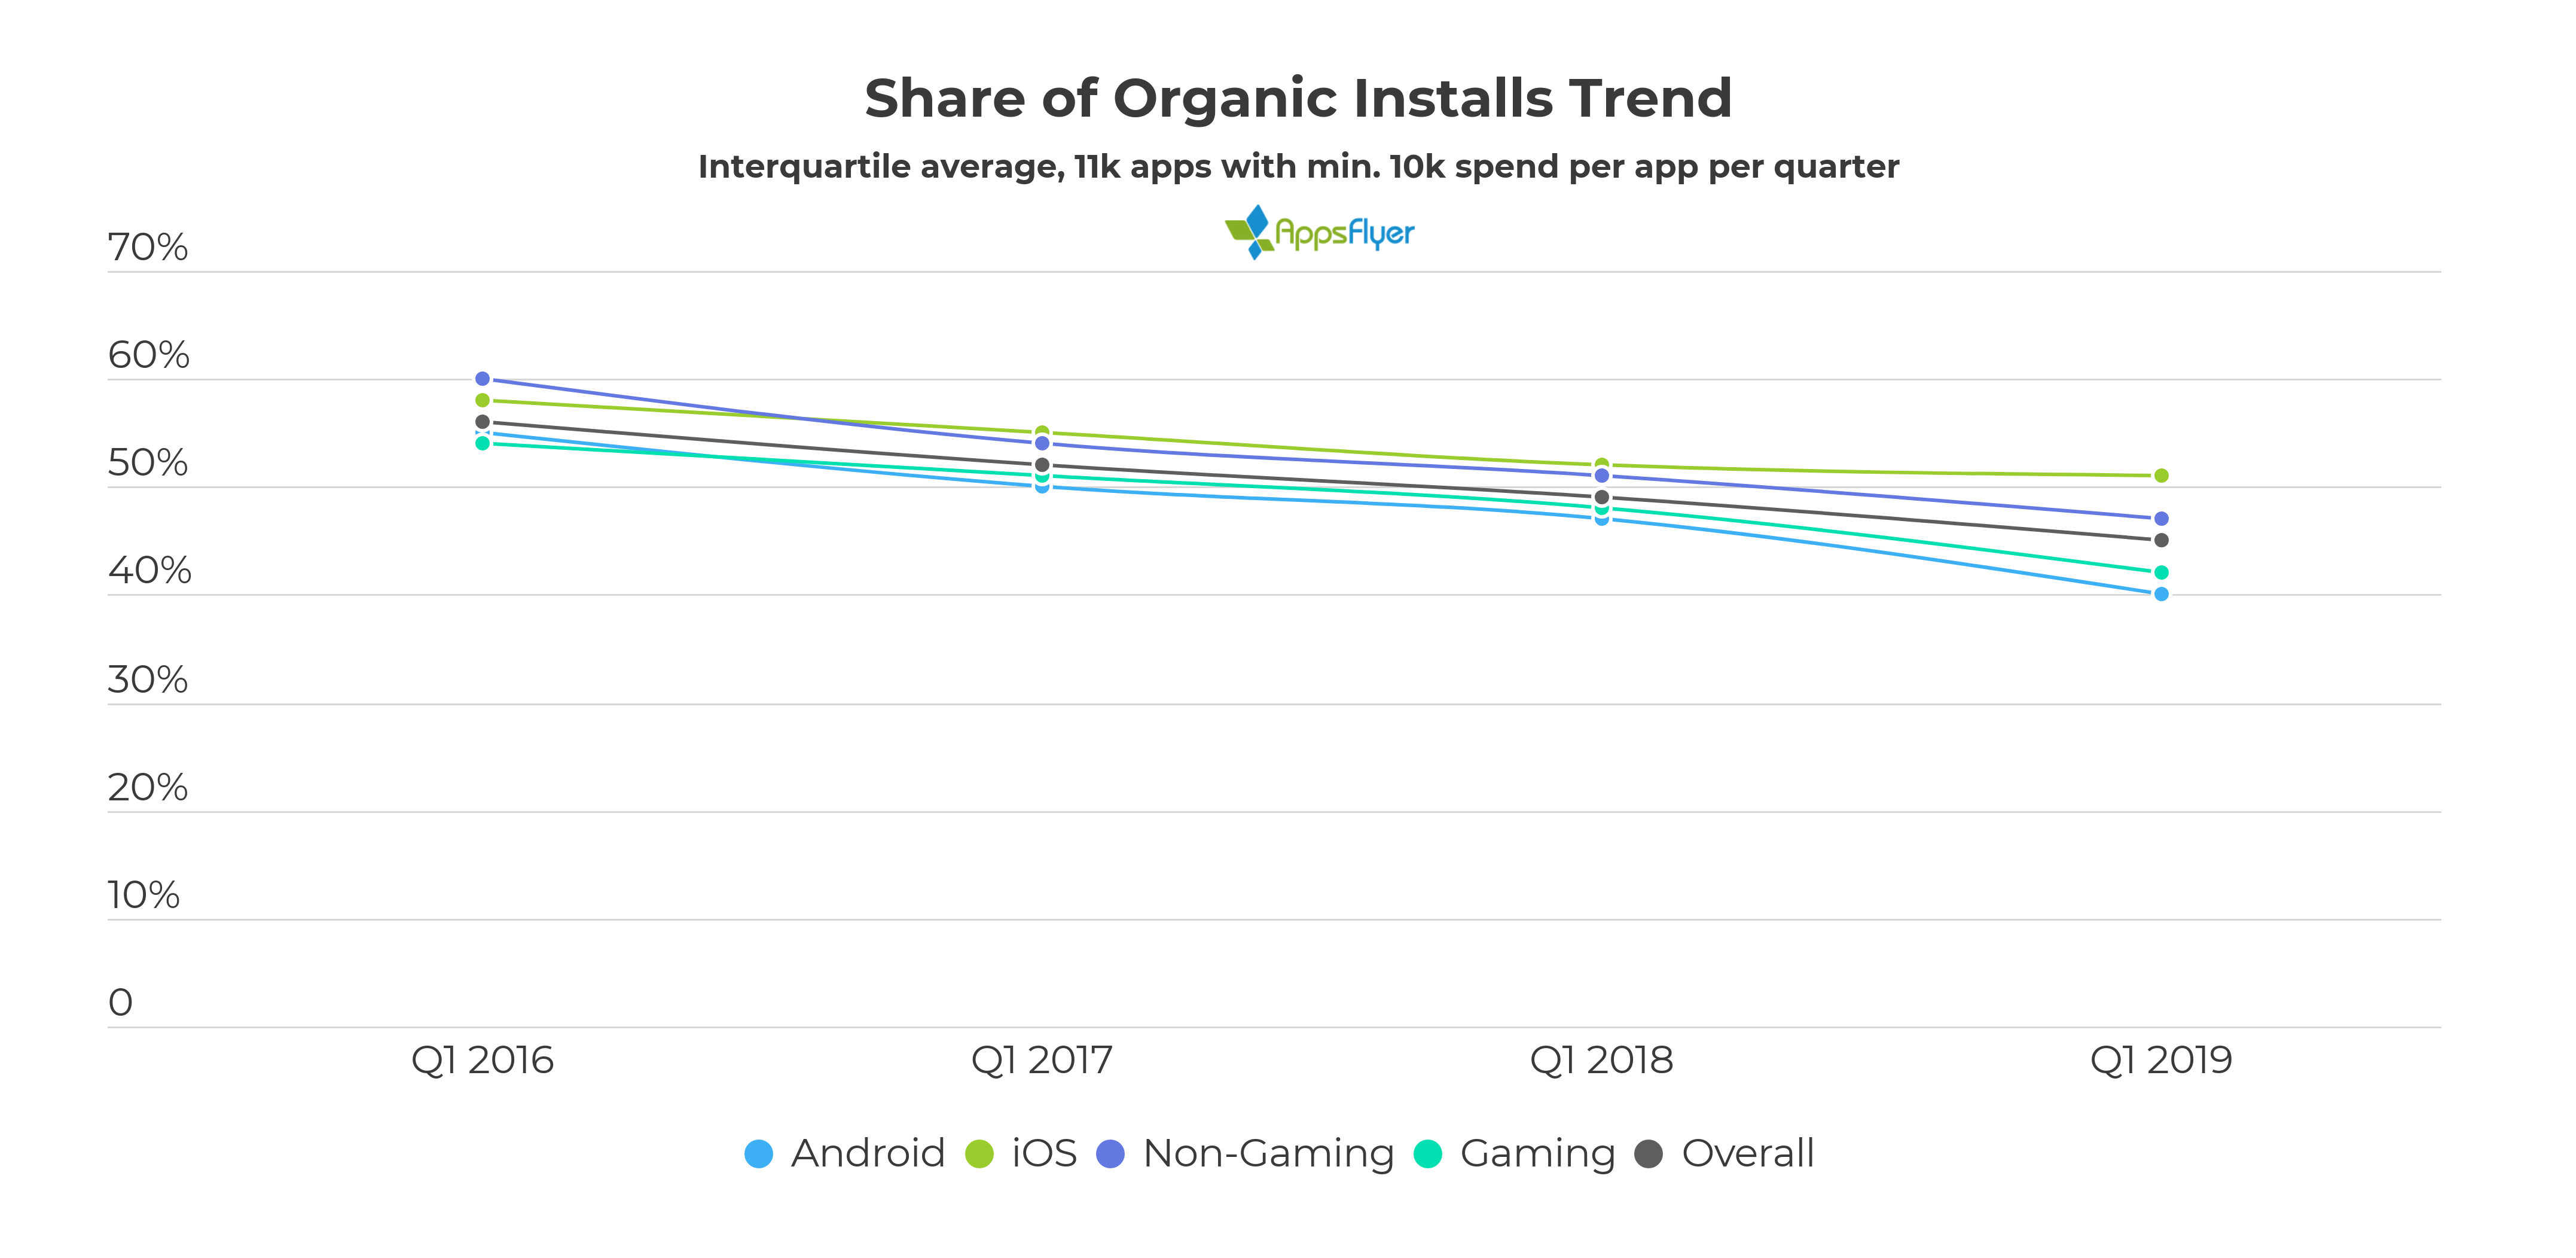
We can see that the organic decline was equally demonstrated across gaming and non-gaming apps, although the organic share in non-gaming is about 10% higher than gaming in 2019.
Interestingly, the drop was particularly high on Android, with a 25% lower organic share in 2019 compared to iOS.
Why is there such a significant difference between the two operating systems?
Gabe Kwakyi from mobile marketing consultancy Incipia explains that this gap is largely the result of Google’s push into monetizing mobile. Just as with its original Google.com search product, Google has steadily been filling the organic discovery environment with progressively more ads.
According to Kwakyi, in 2015, Google announced that any advertiser who wanted to run app ads would only be able to buy them via its Universal App Campaigns product. This began laying the groundwork for advertisers to pour ever more dollars into its advertising algorithms, increasing demand for mobile ad placements. It was a gamble which threatened that some advertisers would pull their budget in protest for buying from a black box, but it’s a gamble that paid off.
Just take a look at the recent AppsFlyer Performance Index.
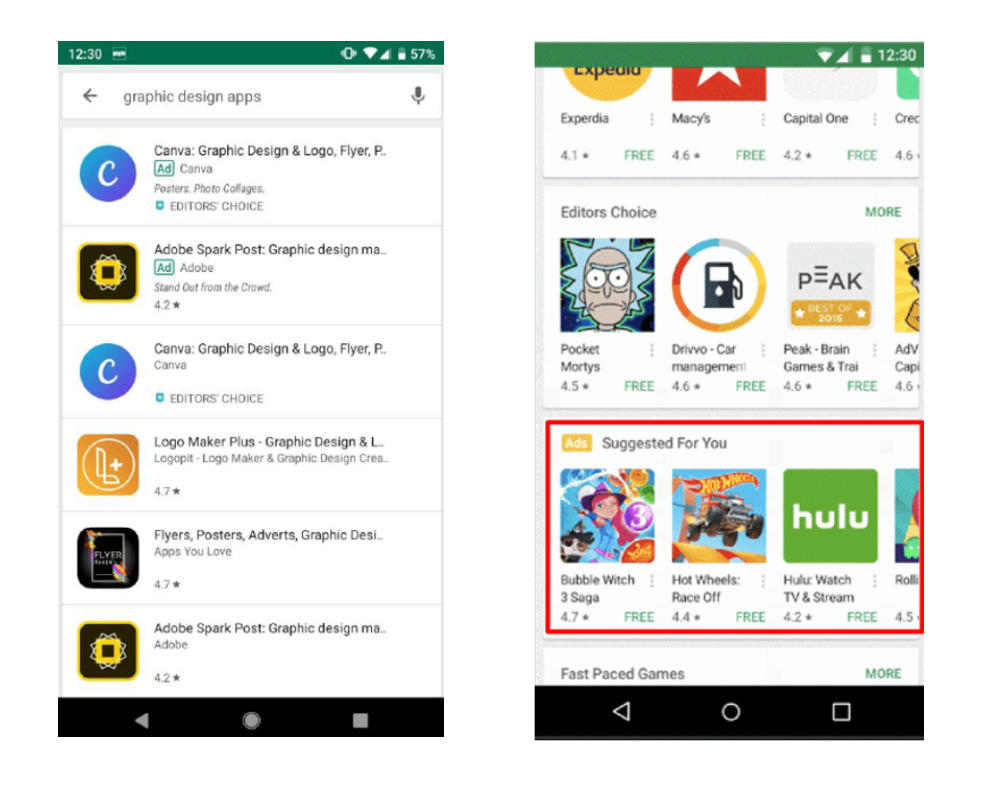
As Thomas pointed out in a “history of ASO” keynote from the ASO Conference Berlin on May 22nd 2019, Google started ramping up monetization by placing a second ad unit in the search results page.
This was followed by an aggressive increase in the number of ads strewn throughout the Play Store app, slotted into suggested app collections alongside organic suggested app collections. This was a significant evolution which expanded Google’s app advertising inventory beyond the keyword search (a limitation still in place for Apple Search Ads) into other areas of the Play Store UX. Google even began testing video ad placements in the Play Store.
With these changes, Android advertisers have become increasingly enticed (and even obliged) to fuel their growth via App Campaign spend. Moreover, as Google’s machine learning algorithms improve targeting and more Play Store real estate becomes devoted to ads, the gap in organic contribution margin between Android and iOS only seems poised to widen.
Get the latest marketing news and expert insights delivered to your inbox
How to measure your app’s organic uplift
Measuring the organic uplift is not necessarily straightforward, and is likely to vary heavily across apps, categories, and operating systems.
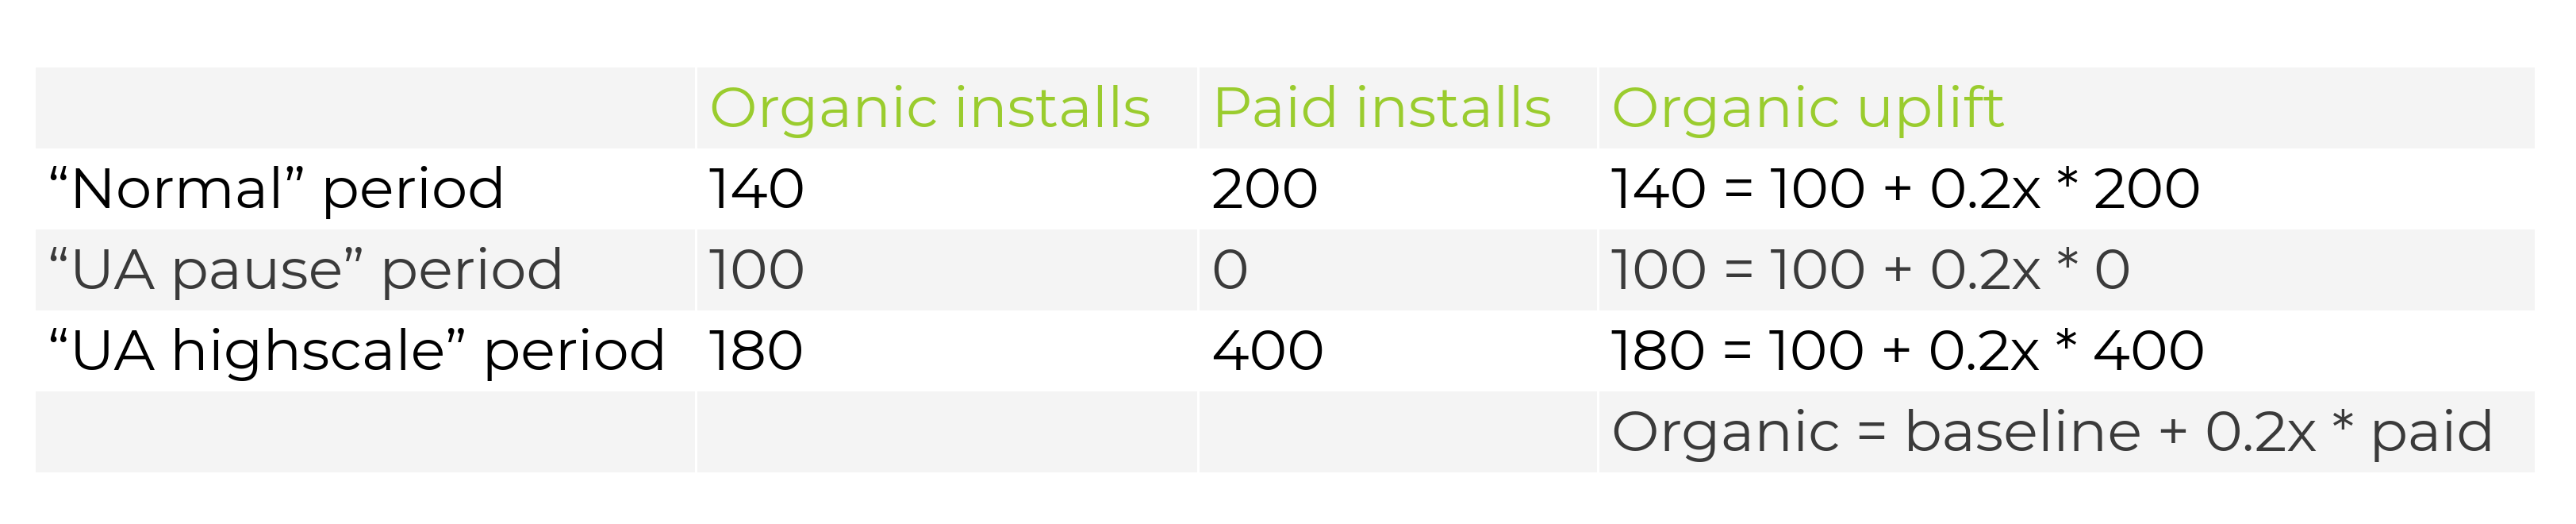
Organic uplift general formula:
Organic installs = “baseline” + organic uplift * measured installs
Which translates into:
Organic uplift = (Total installs – organic baseline – measured installs) / measured installs = (Organic installs – Baseline) / measured installs
Organic uplift methodology: Data analysis
Try to extract a large dataset of non-organic vs organic installs, while ensuring you are slicing up data by OS & country and removing outliers (more about this in the tips section). Using known data (total installs, organic installs, non-organic installs), run a mathematical analysis to establish the two missing values: baseline and the organic uplift.
While the value can heavily vary between different games/apps, the methodology to calculate the organic uplift is similar for gaming and and non-gaming apps.
Here’s a trivial case for representation purposes:
One more thing about the organic “baseline”… You may read on the internet that the organic multiplier is the same as the k-factor, while its formula would be simplified to:
One more thing about the organic “baseline”… You may read on the internet that the organic multiplier is the same as the k-factor, while its formula would be simplified to:
Organic installs = f ( measured installs)
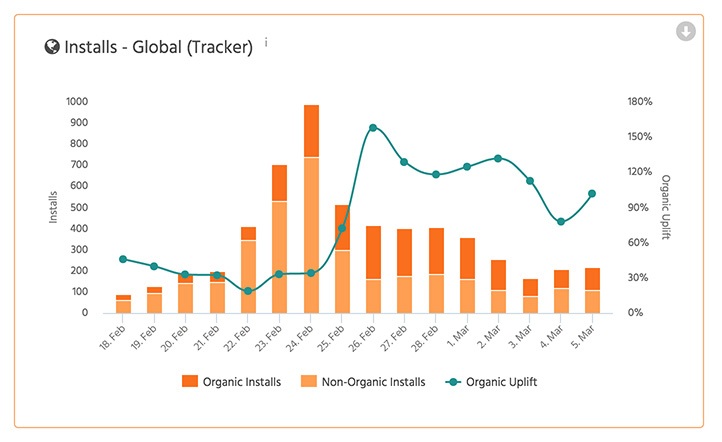
Some tools even allow you to visualize this effect over time, which is quite helpful:
However, be careful when looking at organic as a whole. Even when removing outlying dates, without the baseline, you still have a mix of ASO, virality, and many other factors. Both Thomas and Matej agreed that removing the baseline is important. Your overall brand awareness and a large part of your ASO traffic (both Search & Browse) are not entirely a direct result of your paid UA campaigns.
To learn more about the intricacies of organic installs, watch our MAMA Board video: Dispelling the Organic Growth Myth
Additional tips
Alternative methods
- Shut down paid activity and measure organic after a period of time. For many, this might be problematic, either for strategic reasons (growth goals) or due to channel mechanics (Google or Facebook campaigns running on event or value optimization would be penalized by pausing, and would incur cost to restart). To avoid pausing paid UA, you can:
- Find a country with zero daily organic downloads, and buy a certain amount of users – let’s say you would buy 1,000 users. If you notice after a set period of time that you have 1,200 users, you would know that 200 installed your app organically as an indirect result of your paid UA campaign.
- Find a country without paid UA campaigns, using only organic downloads as a baseline. Then, buy a certain amount of users – say, 1,000 users. If you notice after a set period of time that you have 1,200 users, you would know that 200 installed your app organically as an indirect result of your paid UA campaign.
Don’t forget to remove outliers
Getting featured by the store can also skew the data by driving additional organics that are unrelated to ad spend and UA activity. Also, before running your analysis, you should remove days with significant install volume to avoid adding bias to the organic uplift calculation.
Separate non-performance channels
Know that, by their very nature, some channels escape the rule: any paid media that doesn’t allow view-through, links, or API measurement, or in cases when the link is buried, will only be clicked on by a fraction of users (for example, on Instagram and Youtube)
Such instances can occur in:
- Most branding campaigns without links
- Offline channels: TV, OOH, Radio
- Many online channels, such as Spotify, Podcasts
- PR
- Influencer marketing campaigns
Compare uplift from different segments
The organic uplift may differ vastly across segments (OS, country, vertical, channels) for the same app.
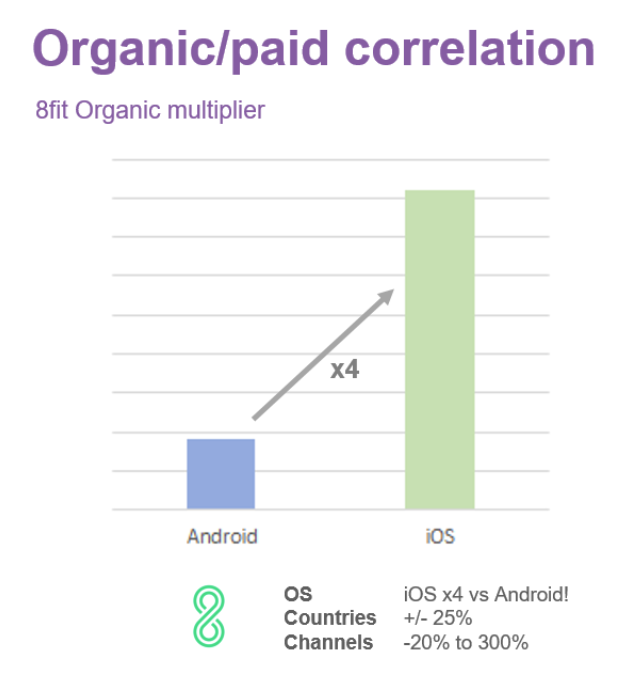
In 2017, Thomas shared at the Organic Party in Barcelona that the uplift of 8fit was 4x higher on iOS than on Android!
The organic multiplier can also vary across channels, with the “quality” of traffic from different sources differing alongside the degree of virality. Some exposure generates higher indirect impact than others.
In particular, try to compare channels with extremely high IPM & CPM (such as Search) vs low IPM by categorizing non-organic installs into tiers of sources. Channels with low IPM are potentially more likely to produce a higher organic uplift.
Monitor Direct ROAS and blended ROI in parallel
There are many ways to take the organic uplift into account, but one thing is certain: it is a moving target (by country, OS, time, scale, etc).
Therefore, integrating it within your UA and measuring only your projected ROAS (paid UA ROAS = measured ROAS * organic uplift) could lead to mistakes.
Instead, you may want to determine two layers of targets in your performance marketing: direct ROAS & blended ROI, and monitor both values in parallel at all times.
In short
The organic multiplier is a key metric to focus on.
Even if the number has dropped over the years, even a fraction of organic users are vital for app marketers as they reduce the effective cost and drive profitability.