How is churn rate defined in the context of mobile apps?
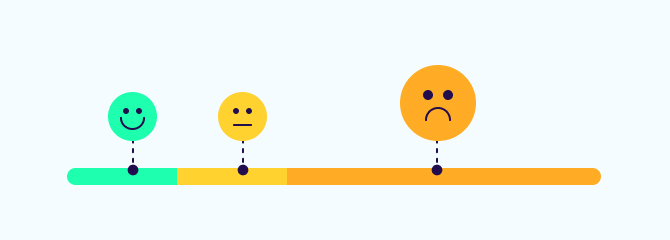
Churn rate measures the percentage of users who stop using an app within a given timeframe. This disengagement may be due to dissatisfaction, competition, or other factors.
Try searching for

Churn rate represents the rate at which customers stop using your product or service. In the mobile app world, it refers to the rate at which users disengage from your app.
Churn rate, also called rate of attrition, measures how quickly a company loses customers within a set timeframe. In the context of mobile apps, it represents the percentage of users who have discontinued using your app – whether they uninstall it, cancel their subscription, or just let the app sit there unopened and unloved.
This disengagement can happen if users are dissatisfied with your app, if they’ve switched to a competitor, or in response to other factors such as affordability.
A high churn rate can significantly impact your business’s profitability and hinder its expansion. That’s why it’s essential to make reducing churn and enhancing user retention a top priority to ensure continuous growth and financial success.
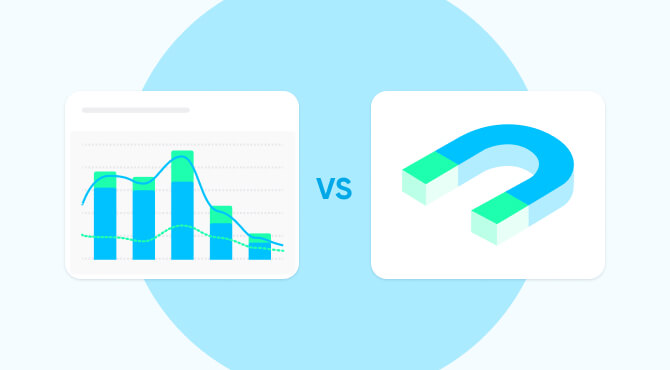
Churn rate quantifies the proportion of users lost in a specific period, while retention rate indicates the percentage of existing customers who continue using your app.
Suppose your mobile app starts the month with 1,000 users, but by the end of that month, 200 users have decided to switch to a competitor. In this scenario, your app’s churn rate for that month stands at 20%. On the flip side, the retention rate for the same month would be 80%, reflecting the percentage of users who stay committed to your app.
User churn rate is a reliable metric to assess customer satisfaction and business health, often serving as a primary KPI for app companies. You can use it to track how many users leave your app and why — helping you determine how ‘sticky‘ your app is.
Another important thing to note is that losing a customer doesn’t only mean losing revenue. You also face the cost of acquiring new users, including marketing expenses and sales costs.
Churn rate informs businesses about customer lifetime value (LTV) and sets the budget for acquiring new customers (customer acquisition cost, or CAC). By analyzing the LTV-to-CAC ratio, you can gauge spending efficiency. If your ratio is 1:1, your costs are wiping out your value and you’re not making any profit.
Here are some more reasons why monitoring churn is essential for app success:
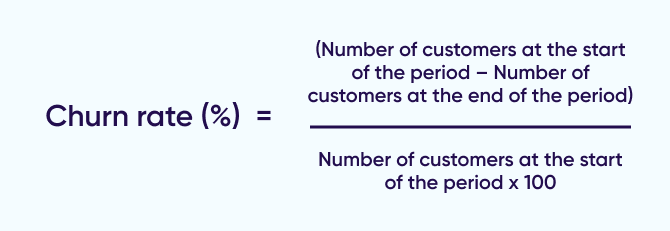
Here’s the formula to work out your churn rate:
By measuring your app’s churn rate on a regular basis, you can track and improve your app’s user satisfaction and stickiness.
You may want to do this monthly or annually. Tracking monthly churn gives you a close look at month-to-month growth and retention, while annual rates can reveal year-over-year growth trends. Here’s how the two timeframes work:
Suppose you have an app that starts the month with 10,000 users and ends the month with 8,500 users.

A 15% monthly churn rate means you lost 15% of your user base during the month.
Let’s say your app’s user count at the beginning of the year is 50,500, and by the end of the year, it’s dropped to 45,000.

Your app’s annual churn rate is 10.89%, indicating your user base reduced by 10.89% over the year.
Having a zero churn rate is ideal for any business, but it’s an unattainable feat in reality. Regardless of the circumstances, some user attrition is inevitable. In fact, the average app loses 77% of its daily active users (DAUs) within the first three days after install.
Generally, an annual churn rate of between 4% and 7% is seen as manageable. However, it’s crucial to understand that different industries have their unique benchmarks for what constitutes an acceptable churn rate. So, a “good” churn rate for your app should not only align with your specific goals, but also consider the prevailing standards within your industry.
From a buggy app and bad customer support to steep subscription prices and the wrong target audience, users can churn for a multitude of reasons. It may be that they aren’t achieving their desired outcomes through your app, feel your competitors are better, or no longer see the value in your app.

So how do you pinpoint the root cause of your app’s churn? Here’s a quick step-by-step guide:
Next, let’s discuss the measures you can take to reduce churn.
Cohort analysis improves user retention by pinpointing when and why users churn. You can then further investigate the reasons that led to churn, and take targeted actions to keep users engaged with your app.
So, how does cohort analysis reveal why users churn? It highlights critical moments in the user journey. Instead of looking at all your users together, cohort analysis divides them into related groups. Comparing these groups over time makes it easier to determine the root cause of churn, as well as identify what keeps users coming back.
Here are some key questions to ask:
For instance, suppose you run a food delivery app. Initially, users order within three days, but by Week 2, activity drops. Cohort analysis reveals that frequent orderers log in between 10 AM and 11 AM, and those accessing the app after noon tend to leave quickly or abandon carts, with 98% becoming inactive within a month.
You can send personalized push notifications between 10 AM and 11 AM with promo codes to boost engagement — a strategy made clear through cohort segmentation.
Churn commonly takes place at the beginning of the user journey, and the biggest culprit is the absence of an effective onboarding program that teaches them how to use your app. This shifts the responsibility of figuring out how the app works onto the user — and that’s risky business.
To ease this transition, set up a comprehensive onboarding process to guide new users through your app’s features and functionality. Reduce the number of steps to simplify app experience and ensure users reach your app’s “Aha!” moment faster. This will make users feel supported and empowered to succeed with your app, making them less likely to churn.
Personalized experiences are no longer a nice-to-have — today, app users expect and demand them. So, the better your app meets their needs, the lower your churn rate will be.
Think about how you can customize your app’s user experience based on the features they use most frequently, and the rewards that excite them the most. Use relevant and targeted messaging that resonates with your users.
Note that this isn’t a one-size-fits-all tactic. You need to leverage behavioral data like search and purchase history, user preferences, and device type and location to customize interactions.
Sending triggered reminders to your user’s home screen is a handy tactic to encourage engagement and ensure repeat visits. Use owned media channels like in-app messaging, push notifications, SMS, and email to reach out to users before they need you. This shows you’re invested in helping them get the most out of your app.
Deep linking empowers developers to redirect users to precise in-app locations, ensuring a smooth and convenient app experience.
Imagine a user exits your gaming app midway through a game. You can send them a push notification as a gentle nudge to re-engage them, and deep link it to transport them directly to the exact point in the game where they paused.
This not only eliminates the need for manual app navigation, but also enhances user retention and engagement.
To prevent people from ditching your app, you need to figure out why they’re leaving and fix it.
Check your app data to see exactly where they’re dropping out. Is something not working right? Are there too many tutorials when they start? Maybe you’re sending too many messages or asking them to pay too soon? Examining your data closely will help you identify churn causes and keep more people using your app happily.
Churn rate measures the percentage of users who stop using an app within a given timeframe. This disengagement may be due to dissatisfaction, competition, or other factors.
Churn rate quantifies the loss of users over a period, while retention rate shows the percentage of users who remain active, indicating customer loyalty and app engagement.
Churn rate is essential for understanding customer satisfaction and lifetime value (LTV). Monitoring churn can highlight areas for improvement in user retention, product-market fit, and acquisition spend.
To calculate churn rate, divide the number of users lost in a set period by the starting number of users, then multiply by 100. This can be tracked monthly or annually to monitor retention efforts and growth trends.
An acceptable churn rate varies by industry, but an annual rate between 4% and 7% is often manageable, aligning with specific business goals and industry benchmarks. No business can expect a zero churn rate.
Strategies to reduce churn include running cohort analysis, optimizing onboarding, personalizing experiences, re-engaging users through targeted communication, and addressing identified issues to enhance user satisfaction and retention.


