Bridging the gaps between predictive marketing and SKAN


Timing is everything.
It can make the difference between a huge success and a resounding failure.
It can make or break a product’s go-to-market strategy.
When we initially set out to develop AppsFlyer’s predictive analytics solution, we of course had our ecosystem’s best interest in mind, as it would provide an amazing competitive edge to any marketer adopting it. That, for us, was sufficient reasoning to get this elaborate and complicated development process started.
With the product’s initial version reaching its MVP stage, we started onboarding our first development partners and set the beta testing phase underway.
Our timing couldn’t have been better.
In WWDC 2020 Apple first announced their intentions of taking the mobile app economy into the age of user privacy.
The ecosystem started rumbling about SKAN, ATT, the death of IDFA, and how to make the most of a newly introduced six bit structure. However, where many saw limitations, we identified opportunity.
Identifying correlations between problem and solution
When examining Apple’s newly introduced guidelines, we can narrow them down to three main constraints on the average marketer:
1. Limited measurement window: By default, SKAdNetwork allows marketers to measure a journey of 24-48h, from install/re-install to post-install activity.
2. IDFA opt-in (ATT): Users will have to opt-in to provide their advertising identifier, making IDFA dramatically less available. ATT places user privacy front and center for all mobile marketing initiatives.
3. One postback to rule them all: marketers have to base their entire optimization decisions on one aggregated postback that includes both the install data and one conversion value. This postback is delivered via a six bit mechanism, giving marketers a maximum of 64 conversion values that they can use to measure various quality indicators.
In a nutshell: A (very) limited measurement window, strict privacy requirement, and a reliance on one value to encapsulate the entirety of a user’s LTV potential.
While these constraints seem to go directly against everything mobile marketing stands for, they perfectly match the core logic of our newly formed predictive solution.
Identifying opportunity in a challenging situation
The science of Predictive analytics, at its core, eliminates the need to rely on user identity, as it constructs an anonymous prediction for future events (market shifts, weather trends, price drops, or in our case user LTV) based on previous measurements (user behavior). The predictive output can be presented in whatever form that serves its purpose – we chose to represent it through a numeric score. These predictive results are meant to be produced within a minimal timeframe (otherwise they wouldn’t be called predictions) by identifying correlations between very early measurements and their eventual results.
We decided to look at the 24 hour measurement window as an opportunity to produce an LTV prediction. This prediction would represent the entirety of a user’s journey in the app during that limited time frame.
But this was only the first step.
Making necessary modifications
While the conceptual match was there, there were still adjustments to be made.
The first challenge would require us to change our MVP’s original setup which provided campaign level scores and transition into a product that could calculate user-level predictive scores and then present these scores in an aggregate way to comply with SKAN’s requirements.
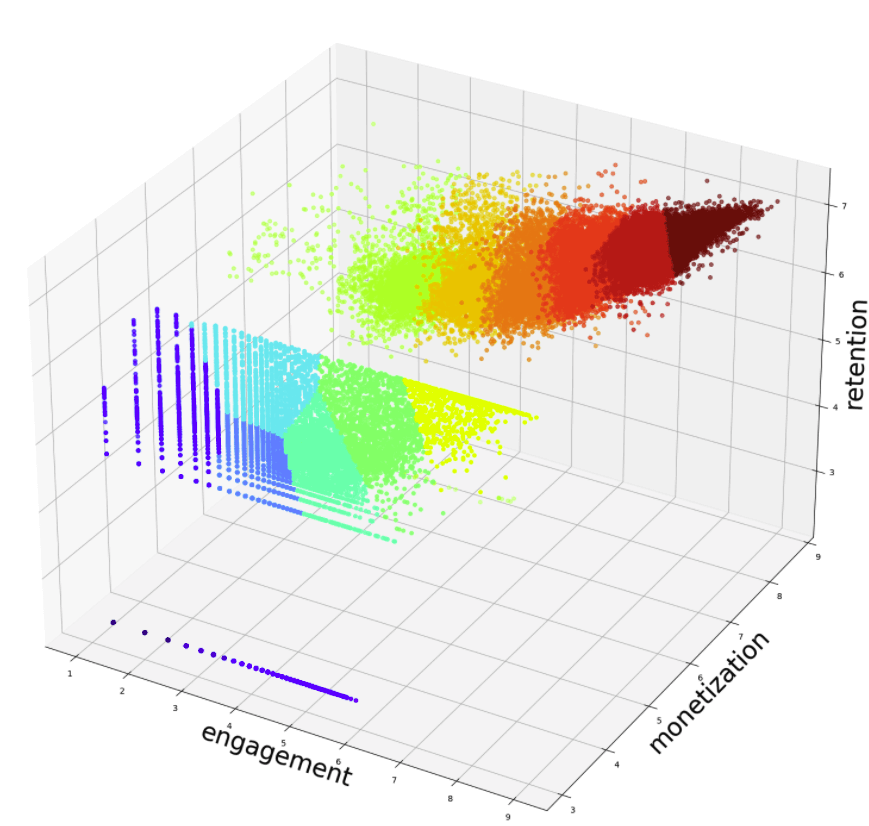
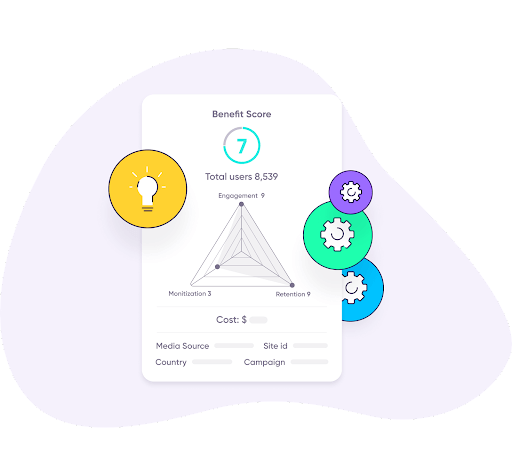
Deep Learning models enabled us to predict three predictive scores: Monetization, Retention, and Engagement – each receiving a predictive score ranging from 1-9. These three scores would construct the user’s overall benefit score, also ranked from 1-9.
One possibility that came up was to communicate only the benefit score which encapsulated all three pillar scores (which represent all of the user’s behavioral data). This would have been a simple and elegant solution; however, it would also mean losing the granularity of each of the scores, which was unacceptable for us.
We were basically looking at 3^9 score combinations (729 overall) which we had to somehow communicate using only the 6 bits Apple allowed us to populate in the conversion value (64 values overall).
When looking into the scores data, we identified that there is a clear linear relationship between engagement, monetization, and retention. Meaning, if a user receives a high retention score they’re more likely to have a better engagement score too. The same relationship also exists between high engagement scores which are more likely to produce higher monetization scores.
This was a groundbreaking insight, as we realized that we might be able to divide the users into groups, AKA cohort analysis. The only question remaining now is how do we find these cohorts efficiently and automatically.
At that point we started to look at unsupervised machine learning algorithms that could identify patterns within the data. These algorithms allowed us to analyze user scores and receive different user cohorts based on the machine’s interpretation. As anticipated, the linear relationship between predicted scores enabled the algorithms to produce well-defined user cohorts.
Some types of unsupervised ML algorithms require a clear definition of the number of cohorts required, which in most cases acts as a downside, while the optimal number of groups one would have in the data is often unknown beforehand.
However, in our case we knew exactly how many user groups we wanted to create. It was well defined by the number of bits available to us in order to communicate the conversion value.
After predicting the three different predictive scores per each user, these scores will be passed through an unsupervised algorithm and will be given a cohortID based on its performance. The cohortID will be encoded in the conversion value. This way we were able to produce 16 cohorts broken down on a scale of 0-15, which made the job of aligning with the 64 conversion values significantly easier, aligning with SKAN’s expected conversion value logic.
Once we receive the cohortID back into our SKAN framework we are able to decipher it back to the three predicted scores we had initially produced, along with any additional data provided by AppsFlyer’s media partners.
The campaign’s predictive scores will now be displayed to the advertiser in an aggregate way, encapsulating all of their campaign’s users’ scores.
All done? Not quite, we now had one more challenge left to tackle.
PredictSK beta is live
Providing predictive insights for media partners
Media partners and their associated media sources are an integral part of the online advertising chain.
AppsFlyer’s media partners base their campaign optimization decisions on whatever traffic quality feedback they receive from the advertisers. The original implementation of our algorithms assigned cohortIDs in such a way that scores were associated randomly to each cohort and had no ordinal meaning. We wanted to be able to provide our media partners with a quick way to take these cohorts and use them for advertising optimizations.
To do that, we decided to modify the ML algorithm such that cohortIDs will help reflect a cohort’s relative value and benefit, so a user with a cohortID of 7 will be more valuable than a user with a cohortID of 3.
Now, knowing that the cohortIDs have ordinal meaning, we can safely let our partners rely on this feedback and feel free to base their decisions on this indication.
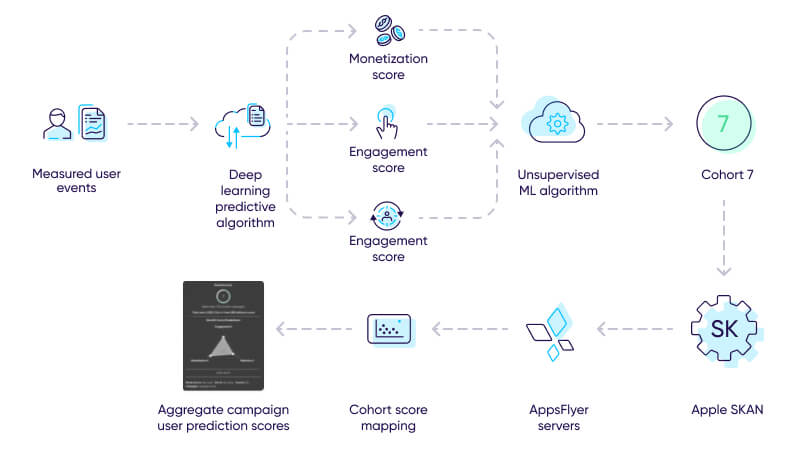
The prediction communication process between advertiser, SKAN, and media partner was now streamlined with PredictSK:
- PredictSK measures user events until it reaches a sufficient data threshold in order to produce a solid predictive benefit score.
- Advanced ML models produce three predictive KPI scores per each user.
- Three predictive scores are communicated to an unsupervised ML algorithm and produce an output of a cohortID on a scale of 0-15.
- CohortID is encoded in the conversion value.
- PredictSK receives the postback from Apple’s SKAN framework.
- CohortID is converted back to the three predicted KPI scores, using the cohort score mapping.
- Aggregate campaign benefit score presented on PredictSK dashboard, consisting of three predicted KPI scores per the campaign’s users, alongside media partner data.
Get the latest marketing news and expert insights delivered to your inbox
Key takeaways
The modifications required to make our initial predictive analytics MVP into a functioning SKAN solution would not have been possible had we not initially decided to develop the initial product to begin with.
The road to the end solution would have been significantly longer and more complicated if we were to only launch the development process later.
Timing had a big part to play in PredictSK’s product development process. The challenges our team had to solve to bridge the gaps between Predict and SKAN allowed us to introduce more value to an already trailblazing solution.
More innovative features are set to be released as we gear up to the next steps in our solution’s evolutions.
Innovation invites opportunity.