

After 15% slump due to the economic downturn, global app install ad spend is projected to rise 20% to $94.9B in 2025


Global app install ad spend — or the money mobile apps spend to acquire new users to install their apps — is projected to reach $94.9 billion in 2025, representing a 20% increase from 2023, according to AppsFlyer’s latest forecast.
However, ad spend is set to fluctuate considerably due to the current economic downturn and the expected recovery — from a 15% drop between 2021 and 2023 to a 20% rise between 2023 and 2025.
Change, change, change
The mobile app marketing ecosystem has experienced significant and even unprecedented developments in recent years.
Apple’s introduction of its App Tracking Transparency (ATT) framework in April 2021 as part of iOS 14.5 has heavily impacted marketers’ ability to measure and optimize their campaigns as the focus shifted from user level data optimization to aggregate. Since then, alternative measurement solutions have emerged giving marketers increased confidence, but it has yet to reach the levels seen prior to the change.
On top of that, ATT was released in the midst of the Covid-19 pandemic, which in itself led to significant change in the form of rapid digital acceleration across the globe due to lockdowns and social distancing policies. This period was well utilized by mobile apps, which ran aggressive user acquisition (UA) campaigns, particularly among games. But contrary to many projections, a post-Covid digital cooldown ensued and digital usage returned to pre-Covid levels.
And if all that wasn’t enough, the global economic downturn and rising inflation rates erupted in 2022, impacting mobile businesses in the second half of 2022 and into 2023. As a result, many consumer-facing B2C mobile apps have reduced their marketing budgets and in some cases also cut staff. In addition, the war in Ukraine delivered another shock to the global economy, especially to energy and food markets, squeezing supply and pushing up prices, particularly in Europe.
These developments caused quite a bit of volatility. Between 2020 and 2021, Covid-19 and ATT shaped ad spend. Had it not been for ATT, the rise in spend would have likely been much higher than 40%.
In 2022, we experienced a Covid-led surge in January when Omicron hit, but then in Q2 and especially in H2, the war in Ukraine and the global economic downturn took their toll, not to mention the continued effects of privacy-driven data restrictions. Despite the fact that the industry has adapted to some extent, the market is still not where it used to be. Overall, after a 40% leap in 2021, the market dropped 5% in 2022.
In 2023, AppsFlyer’s data covers the first five months of the year, while a year-over-year comparison to the first five months of 2022 shows a 20% slump. According to our forecast, and in line with most financial analysts who do not foresee an end to the recession this year, we project that ad spend will drop by 6% this year.
Because a financial recovery is only expected by the second half of 2024, we believe that a strong H2 will lead to a 7% overall growth for that year, followed by a strong 2025 when we predict a 13% growth to $94.9 billion.
Data confidence in the privacy era
Beyond the projected economic recovery, which is the most important factor impacting ad budgets, continued advancements in privacy-enhancing technology (PET) and measurement solutions are giving marketers increased confidence, allowing them to scale up campaigns.
We’ve already seen increased investment in iOS after the initial plunge seen during the release of iOS 14.5 and ATT. Indeed, more and more apps and media sources have adapted to Apple’s SKAdNetwork, and despite the data restrictions continue to invest in this platform because of the high quality, on average, of its user base.
Going forward, the adoption of SKAdNetwork 4.0 with its significant upgrades is expected to reach critical mass, followed by continued releases and enhancements to the solution in SKAN 5.0 and beyond.
Another major development is Google’s planned release of Privacy Sandbox for Android in 2024, which is likely to be much smoother than Apple’s privacy changes, and is expected to give marketers significant visibility into their campaign performance for both user acquisition and remarketing.
One of the most important PETs on the market today is data clean rooms (DCRs) — a secure environment where sensitive data is processed and managed in a way that ensures it is used in a privacy-compliant way.
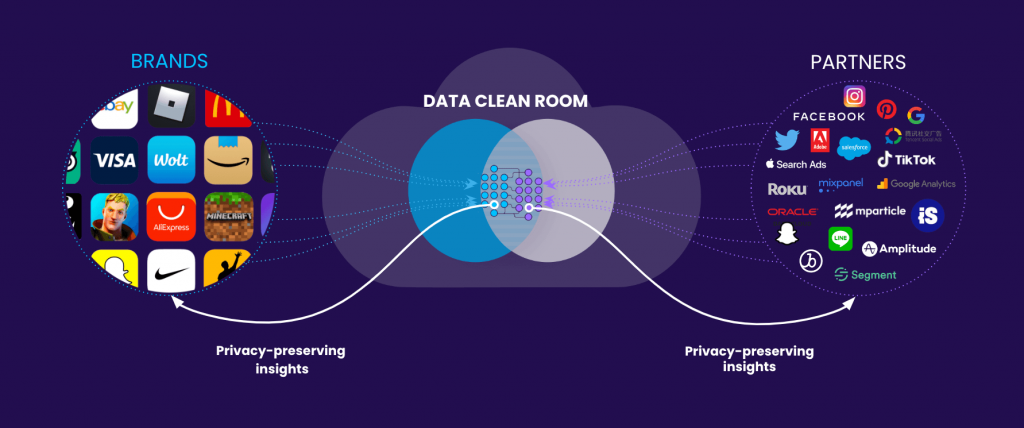
DCRs have gained significant momentum in the past year. Between Apple’s ATT, Meta’s decision to only send user-level data to Mobile Measurement Partners (MMPs) and not advertisers, and the upcoming deprecation of Google’s 3rd-party cookies and device advertising IDs in 2024 as part of Privacy Sandbox, data sharing is becoming increasingly limited. But with DCRs, marketers can join their first party data with conversion data and regain visibility into their campaigns.
In addition, AI-powered measurement and campaign optimization solutions are already making inroads and are expected to surge in the coming years. For example, with the limitations of privacy and more complex measurement journeys across multiple devices for the same user, AI can help to complete the missing parts to better connect the dots.
Beyond the economic recovery and innovation in PETs, other factors come into play: Pressure to meet massive demand in developing countries: With the number of smartphones expected to increase 13% worldwide between 2022 and 2025, marketers are pressured to meet this demand and demonstrate continued growth.
The bottom line
The road ahead is expected to be a bumpy one. But as the headwinds of the economic slowdown are expected to subside at some point in 2024, we expect app install ad spend to surge in the post-downturn reality.
Methodology
Total industry UA spend methodology – the formula combines three buckets:
- Spend as measured by all mobile measurement partners based on an industry wide extrapolation of 3rd party estimates.
- Spend in the non-attributed market (marketing-driven installs that were not measured by one of the major MMPs) — estimated at 5%-10%.
- Spend in China was estimated based on data.ai’s figure of 110 billion installs in the market in 2022 as well as the share of non-organic installs and CPI data.
The predictive model was primarily based on historical data, which included over 85 billion non-organic installs and $60 billion in ad spend between January 2020 and May 2023, as well as external analyst estimates pertaining to financial recovery.