
Finding your true north: Measuring your app marketing’s true ROI


Introduction
Measuring the return on advertising spend — aka ROAS* — is the northern light guiding marketing decisions. That much is obvious to most marketers (or at least should be).
What is less obvious is that the road to accurately measuring the ROAS of your mobile app is slippery and full of potholes, or worse, with a cliff at its end.
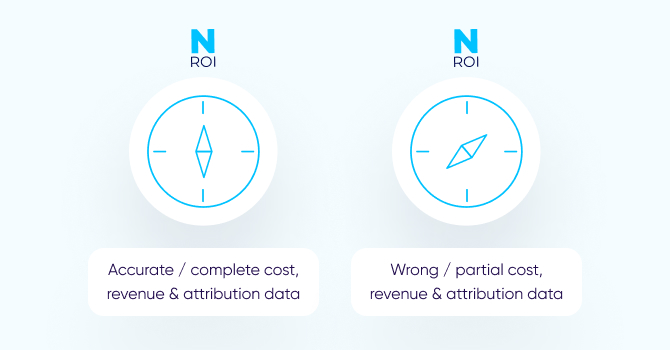
Therefore, an important distinction must be made between ROI and true ROI. Although the two terms are not the same (see below), for the purpose of this guide let’s assume ROI = ROAS.
What separates the two? In one word: accuracy. Working with accurate ROI data is the holy grail for performance marketers, whereas working based off of inaccurate ROI data can completely derail all marketing efforts and even risk your app’s financial stability.
Clearly, true ROI is the outcome of both accurate revenue and accurate cost. But it’s vital to remember that this data is dependent, first and foremost, on the foundation of data-driven marketing: accurate attribution data.
In this guide, we’ll cover why and how each component of True ROI is achieved, highlight common pitfalls, and find out how to overcome the challenges en route to finding your true north.
* A business can measure returns in several ways, often depending on the roles within a company:
- CEO looks at ROI (return on investment), which includes everything, total revenues or even better, profits, vs. total costs.
- CMO focuses on ROMI (return on marketing investment), which takes a broader view beyond performance marketing into account: considering OOH, print, promotions etc.
- UA / Performance Director is driven by ROAS (return on ad spend).
The foundation: What allows for accurate attribution data
True ROI can be achieved with accurate cost and accurate revenue. But the only way to ensure that’s the case — is with accurate attribution data. The ability to meet this standard is anything but trivial. Let’s break it down.
1 – Data accuracy
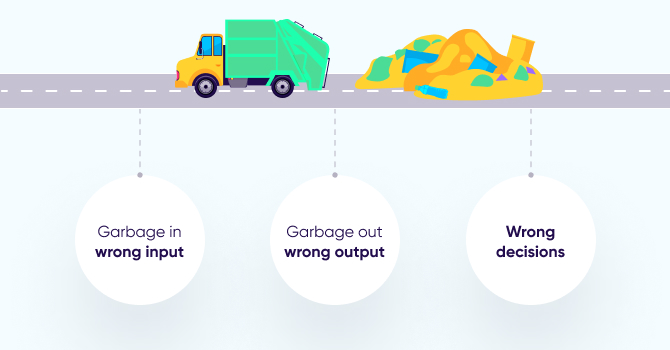
Garbage in, garbage out. Regardless of how sophisticated your marketing BI teams are, if their decision input parameters are wrong, their decisions’ outcome will be wrong too.
In modern marketing, attribution data is the source of the most important marketing decisions. As a result, marketers are often making bad decisions without even knowing it.
There are three main reasons:
- Limited access to user-level data post iOS 14’s privacy changes
- Fraud
- Mis-attribution
In both cases, measurement appears to be correct, demonstrating that you have made the right decisions that have led to profitability. What you don’t actually know is that you are probably buying your organic users and fraudulent traffic.
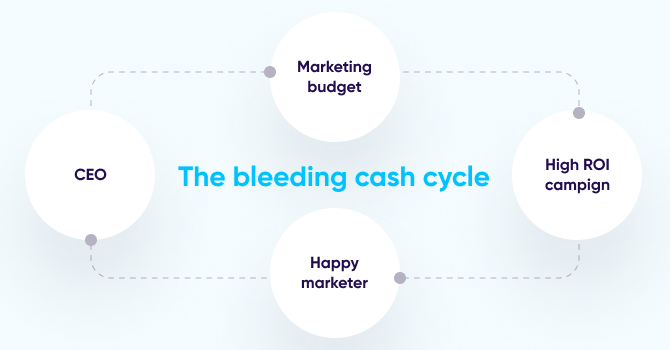
Making that wrong decision over and over again at an increasing scale — will lead to a bleeding cash cycle.
In this cycle, strong numbers lead marketers to ask for more budget from their CEO, and the CEO approves because the numbers look great. However, the numbers are wrong, and the company ends up pouring more money into the wrong sources, draining marketing budgets and risking the company’s financial stability.
How can fraud and mis-attribution be prevented? Mainly with machine learning algorithms that are trained at scale to make attribution data more accurate and clean of fraud. After all, machine learning is worthless without a continuous flow of data at scale to learn from.
Let’s look at Google Search for a moment. Indexing technology has been out there for companies (and theoretically for anyone) to use. So why is it that Google has not been challenged on this front for over 15 years? The answer is simple: The Data! The data collected by the search engine every day is the fuel that feeds its search algorithm.
Technically, it is we, the users, who keep feeding Google with data all day, every day. It’s thanks to this never-ending flow of data that Google is able to offer great search results. In theory, if we all stopped using Google Search and moved to another provider, say Bing, it won’t be long before it would have far better search results, while Google results will eventually become irrelevant.
In mobile marketing, your ability to prevent fraud and mis-attribution and have accurate attribution data — is mostly dependent on the scale of your attribution provider.
Accuracy is also a matter of trust. At its core, trust is centered around the notion of avoiding any conflicts of interest. It all boils down to two simple rules:
- Attribution providers must only sell to advertisers and represent their interests in the ecosystem. Playing on both sides is simply not an option.
- Advertisers’ data must never be monetized or used to build profiles / personas.
2 – Privacy and security
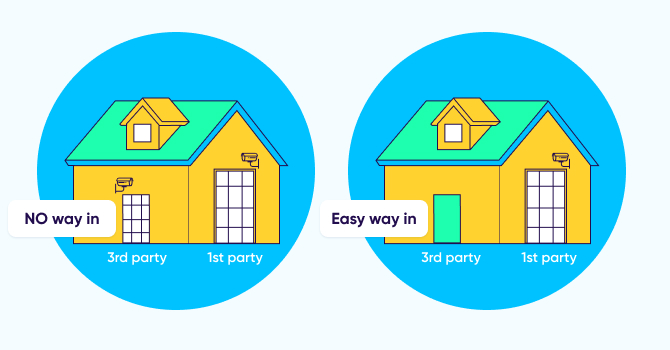
Trust is also about knowing that your data is safe. The problem is that companies often invest in tightly securing their own systems, but don’t give the same level of attention to their 3rd party vendors — that have access to the same sensitive information. This is how they create back doors without even knowing it.
The security and privacy measures you take internally must be mirrored in your demands of your 3rd-party vendors, and security and privacy must be identical for both 1st and 3rd parties. This is the only way to ensure that your back door is as secure as the front door.
Since an attribution provider is essentially a CRM-like SaaS platform with access to your most important asset — your 1st party data — it should be held to the same standards as if it was your own tool rather than a 3rd party vendor.
For example, take the process known as data scraping, which occurs when a joint client of two vendors shares dashboard credentials with the other vendor.
Clearly, it’s both error prone and a severe security risk, and it’s therefore highly recommended to deny a vendor this kind of access to your 1st party data, even if it’s coming from a trusted one.
3 – Tech heavy lifting
Building a robust mobile attribution platform is a significant undertaking. It takes years and years of experience, and there are simply no shortcuts.
Developing an attribution platform that can fulfill its mission is centered on:
- Integrations: Technically connecting with thousands of partners — from media companies, analytics platforms, fraud tools, marketing clouds etc. — and ensuring the transfer of data is fast, efficient, accurate and comprehensive (covering the highest possible number of parameters).
- Infrastructure: When you scale, you quickly find out that beyond a certain amount of machines, traffic and volume, the database just breaks — which can lead to a host of miserable business effects.
For example, a delay in attribution, which causes a delay in postbacks, which then causes a delay in campaign optimization from the ad network side.
Another example could be redundant data pull re-tries, which occurs when a database gives out wrong success / fail metrics — leading to inaccurate
4 – Keyword / site ID / creative level granularity
Attribution data that is not sufficiently granular — at the network level or even campaign level — will translate into sub-par optimization. Only with granular attribution data at geo, keyword, side ID, and ad-set / creative level can you fully optimize your campaigns.
For example, if your campaign uses 5-6 different creative variations, but only 1-2 actually perform, you will not be able to fully optimize your campaign.
Even worse, it may lead you to conclude that the campaign is not profitable, when in fact a simple decision to focus on those 1-2 successful creatives can make all the difference, and move the needle in your favor.
Money coming in: What allows for accurate revenue data
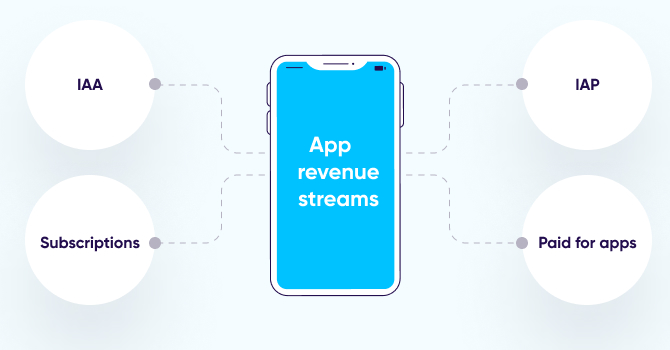
In a freemium-driven ecosystem, free-to-install apps make money through the following revenue streams:
In-app purchases. Apps offer consumers to purchase in-app goods — whether real, such as a flight or a pair of shoes, or virtual like game coins — to be able to purchase a stronger weapon.
Bear in mind that deferred purchases, pending purchases or refunds all occur async to the real-time IAP event — which affects the bottom line.
Subscription revenue. An increasingly popular revenue stream in the last few years, in which users pay a recurring fee every month / year / other for a specific service — like streaming TV shows or music, taking yoga classes, dating, or gaining exclusive perks in games in the form of in-game currency, battle passes, upgrades etc.
Subscription-based monetization strategies are more predictable, easier to test and improve, and ultimately more profitable.
As an added incentive, subscription apps on the App Store receive a higher revenue share for subscription fees compared to non-subscription apps. App Store developers receive 70% of subscription revenue (standard commission on all apps), which peaks to 85% after a year.
When it comes to measuring IAP (in-app purchase) and subscription revenue, the same mechanism applies.
It can be done by configuring an in-app event in an app’s SDK that records the revenue generating event every time a user completes an in-app purchase / in-app subscription. Another option is to inject the data directly into a BI platform through a server-to-server data stream.
For a product or monetization manager, simply knowing how much revenue an app generates from which type of offers might just do. Given revenue data changes, data from Day 0 might suffice for in-day UA optimization, so this really comes down to the hybrid revenue model employed by the app owner.
But for marketers who need to measure their ROI accurately, it is not. For this to happen, there is another crucial layer — the attribution data. Specifically, the ability to accurately connect attribution data to revenue data in order to understand how much money was generated as a result of which marketing activities or channels.
When attribution data is inaccurate, mismatches occur, taking us back to the bleeding cash cycle and the importance of having the right data inputs (see previous section).
Furthermore, if attribution data is not sufficiently granular (e.g. network and even campaign level), your ability to fully optimize towards revenue is significantly hampered.
In the case of IASs, all subsequent lifecycle events — most of which are bearing revenue — occur async to app usage, and after the initial subscription purchase (IAP). These may include renewals, upgrades, downgrades, churn etc.
Ad revenue. Another popular monetization method for apps, especially games. Because the vast majority of users do not complete in-app purchases, having ads in your app can drive revenue from this large segment of users (while not showing ads to users who do monetize through in-app purchases).
Ad revenue is received from ad monetization or mediation networks via server APIs (or by a reporting SDK in the app), and then attributed to the media source that initially delivered the user. Do note that only mediations offer impression-level revenue data from the SDK in real time.
For this to work, it’s important to understand that monetization and attribution data (excluding impression-level data and solutions combining aggregate revenue reporting with impression reporting from the SDK) are completely different data sources that can only connect accurately through user level integrations.
In the case of ad revenue, data is updated in time by design. The same impression that was quoted as 1 cent now, and reported through an SDK connector, will be quoted as 0.99 cent the day later, and might be changed yet again up to 30 days after it took place.
For more on this topic, read our App monetization guide: How to generate revenue from apps in 2022
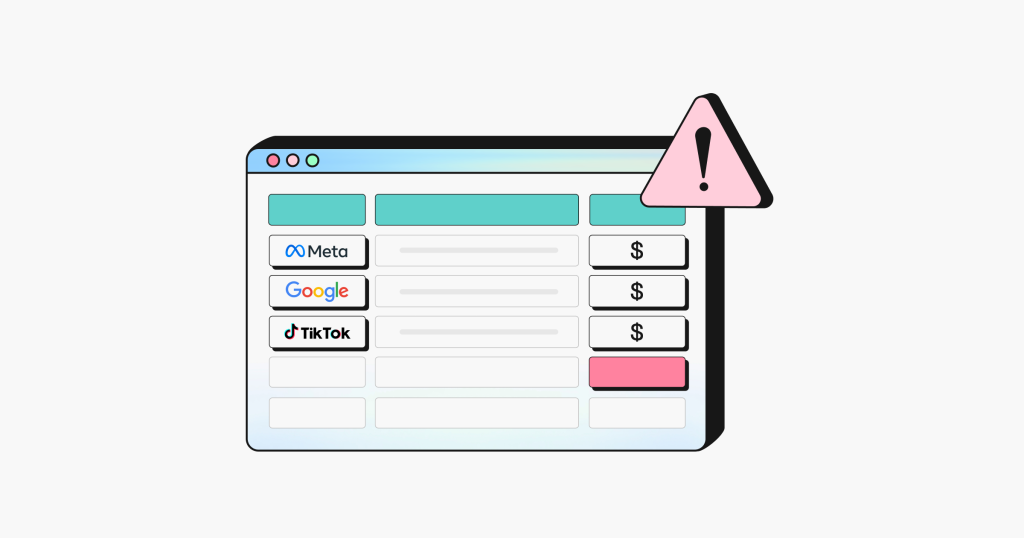
Money going out: What allows for accurate cost data, and what doesn’t…
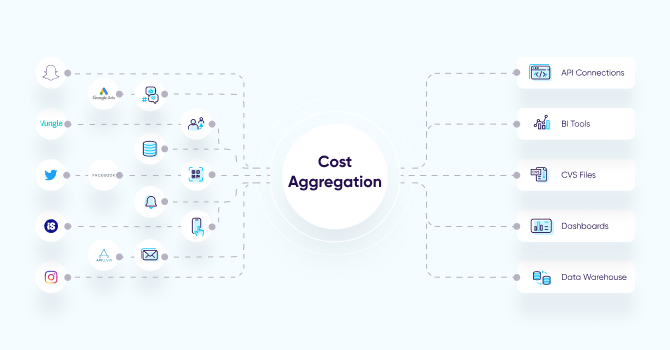
Having accurate cost data is an entirely different ball game. In fact, it’s a massive challenge because of the large variety of data from different cost sources. No two sources report data in the same way, at the same level of granularity and frequency.
For example, each network has different types of metrics associated with cost: Twitter has tweets, Facebook has page likes, Snapchat has swipe ups, and so on.
Adding to this complexity, another layer of fragmentation was brought about by SKAN campaign data, making it far more challenging to consolidate. For example, Snap reports cost at campaign and country level for SKAN campaigns, but reports campaign, adset, and ad for non-SKAN campaigns.
As a result, cost data is extremely fragmented, leading to a lack of standardization, and ultimately a major headache for app marketers. Not to mention it takes them away from their actual day job.
Why is ROAS so hard to measure in a privacy-centric world?
Matching cost and attribution data has always been a big challenge for advertisers, mainly due to the data fragmentation across ad networks.
The average marketer works with several ad networks, and every ad network has its own data scheme, business rules, business models, data refresh rate, etc. The lack of standardization has made it difficult to normalize cost data and combine it with attribution.
With the onset of the Apple iOS 14.5 release and ATT framework, multiple forms of attribution evolved, leading to more data fragmentation: SKAdNetwork (SKAN), privacy-centric attribution, web-to-app and others. The multiple forms of attribution have resulted in new data challenges.
The importance of data standardization
Marketers have to take responsibility for the data sent by ad networks on attribution links, making sure that data is aligned with their analytics needs and at the desired granularity. Needless to say, this comes with a huge overhead.
If the network reports data in their internal campaign ID while you, the advertiser, use your own IDs, you won’t be able to join performance, spend, and attribution data at all.

Additionally, marketers must ensure that the inputted macros (dynamic placeholders on the network side) match the attribution link’s parameters (dynamic placeholders on the MMP side) or SKAN postback parameters, so the data can be recognized by the MMP in the first place.
Without consistency and a well-defined data structure in naming conventions and macro-parameter matches, there can only be, “garbage in, garbage out”.
The reality for these marketers is a painful one, with tedious work of manually generating weekly spend reports for dozens of channels, consolidating endless spreadsheets, combining data from different sources, filling in missing gaps, and correcting wrong data.
Not only is this completely inefficient, it’s also extremely prone to error.
Errors can lead marketers to make the wrong optimization decisions by allocating more budget to a channel that is only performing sub-optimally or actually losing money.
For example, imagine you have partially aggregated the spend of a certain campaign because of the inability to match the data on the campaign ID field / macro ($4,000 instead of $6,000). If the campaign’s revenue is $5,000, then you may think your campaign is profitable when in fact it is not.
Timing and lack of data freshness is also an important factor here. If marketers don’t have the data they need when they need it — it can prevent them from executing timely decisions.
Additionally, cost data is often not at the level of granularity needed to allow marketing teams to act fast on their spending goals, or accurately optimize their campaign budget in any way.
Last but not least, reconciliations on monthly bills with networks is a major source of frustration for app marketers because of the following reasons:
- Up to 25% of fraudulent activity cannot be blocked in real time, but rather detected post-attribution. In such a case, postbacks are already sent to the networks and advertisers are charged for fraudulent installs.
- UA and remarketing budget spent outside defined campaign parameters (geo-bleed, wrong devices, etc).
- Networks miscalculate invoices, causing unnecessary back and forth with advertisers.
- Complex financial agreements with the network. For example, providing rebates for low-quality traffic, which fails to meet the advertiser’s KPIs.
- Baking in fees when working with agencies or other 3rd-party analytics tools.
How can this reality change?
The solution is two-fold, requiring:
- An attribution platform that can collect, organize, and standardize all cost reporting using different methods of collection.
- All of the above under one roof with one vendor.
Let’s explore this in detail.
Setting the data straight
Despite the challenges described above, do not despair! There are ways to overcome these hurdles:
Data standardization
The first step is to define the so-called ‘standard’ Decide which data fields are common and provide a good solution to every possible use case in a way that is simple enough to be consumed and understood. Next, everything needs to be aligned with the new standard — and this requires a lot of effort.
The best remedy to alleviate the lack of standardization pain can be found within a robust attribution platform that can handle this as part of its network integrations, removing significant friction for the advertiser.
This includes:
- Working with each ad network to ensure it sends the entire campaign hierarchy based on the defined ‘standard’.
- Setting up data monitors to ensure that the incoming attribution data contains all the required information to be unified with cost data.
- Fixing any data integrity problems to ensure that the data is accurate.
Data collection
There are multiple methods to extract this data, and all must be supported: API, file uploads, and click.
API reigns supreme
The best method to receive cost data is through an API with the network: the data is accurate, constantly updated, while any changes can be reflected retroactively in a process known as ‘backfill’.
This is important because we know that if there is one thing that is constant about cost, it’s that it constantly changes. An API also supports all business models (CPI/CPM/CPA) and is near real-time.
That said, one challenge with APIs that you should take into account, is the fact that when establishing a relationship with several ad networks, connections might fail for various reasons. It could be because one of the partner’s API is not responding, or an issue with the attribution link data.
In such cases, you need a monitoring mechanism that allows you to identify and solve issues in real-time — to ensure you’re working with the most accurate ROI data.
Ingestion for a complete cost picture
This method allows advertisers to upload ad spend data from any source, even those that don’t have an existing API integration (including owned and earned media, influencers, out-of-home and other traditional media like radio).
The attribution provider then standardizes it and automatically incorporates it to enable a true and complete ROI calculation.
Click, but only if there’s no other way
Sometimes an API is not available, so cost has to be passed on the attribution link via the click data. This method must also be supported despite its flaws (i.e. cost data cannot be changed once recorded even though it is a very dynamic metric, and lack of support beyond CPI).
Owning the data management flow
Advertisers need to have complete control of all their cost data, regardless of the source or method of extraction. Relying on other networks, partners, or channels to pass this data regularly, quickly, and securely for advertisers to make critical decisions is nearly impossible today.
Therefore, having the ability to easily manage partner and agency access permissions allows teams to collaborate on identifying gaps, lags, and inconsistencies. When such a setup is in place, data can be easily corrected on the go.
Take for example the following scenario: a network issues a discount, which the advertiser naturally wants to have reflected in the true cost within their reports and ROI calculation for a given period of time.
Now, imagine how much time is lost when you have to communicate the gap and then process the data correction. When the data management flow is fully controlled by the advertiser, the accurate numbers can be instantly updated and reflected in the UI.
Data consumption
Cost solutions need to make data accessible in the most efficient way:
1. If you have an internal BI system, it’s very important to match your cost data with your attribution data at the right time. Think about it as one API to rule them all.
2. If you’re using your MMP’s dashboard, you’re all set. Simply use the matched data to analyze your ROI.
[Robust] Attribution & cost: better together
![[Robust] Attribution & cost: better together](https://www.appsflyer.com/wp-content/uploads/2022/06/5913_ROI_guide_670x350_03-1-1.jpg)
Marketers who work with different attribution and cost vendors are at high risk of wasting time and money because of inaccurate or incomplete attribution data.
There are several key reasons why this happens:
1 – Sub-par attribution solution
There are no shortcuts to the heavy-lifting required for building a robust attribution platform. Anything short of that means that attribution data cannot be fully trusted.
2 – Data mismatches
When the cost provider is not the owner of the attribution data, its ability to connect this data to its own cost data is a significant challenge.
A proper attribution-cost integration must be uniquely built per ad network, not by building a generic cost integration.
Let’s take the following scenario: an integration built with the API of network A includes field X which the advertiser uses for creatives, but the network that works with the attribution provider passes the creative on field Y. In such a case, your Excel or BI platform will see two separate rows:
- Media source, creative X, cost = 750 (data from the cost provider)
- Media source, creative Y, installs = 1000, revenue = 1500 (data from the attribution provider)
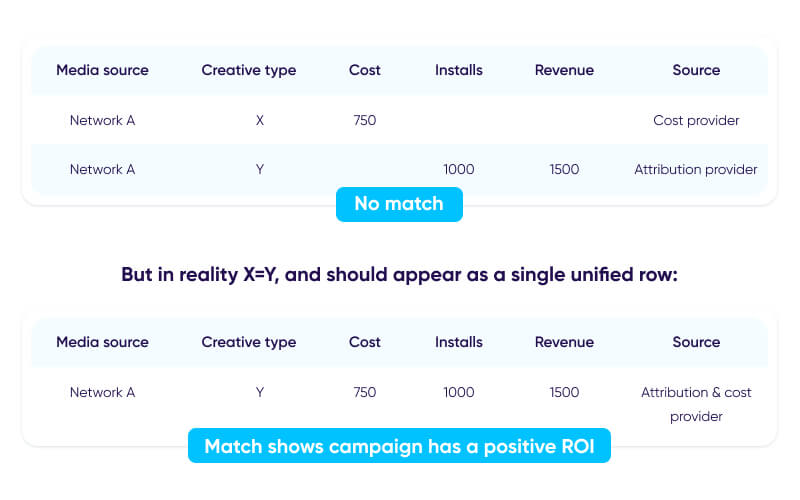
Overall, a massive number of cost / attribution data point pairs that should have been matched are not, leaving out many empty lines instead. The end result: decision-making is based on inaccurate data.
On the other hand, when the attribution vendor has holistic cost data it can easily aggregate, normalize, and standardize both data sets into one ‘coherent’ data set.
3 Privacy & security risk
As previously mentioned, some marketers provide their attribution platform’s dashboard credentials to their cost vendor, which then runs a process known as data scraping to obtain the attribution data.
It’s important to understand that the method of providing access to your 1st party data is both error prone and a severe security risk.
4 – Lack of granularity —> sub-par optimization
In theory, a marketer can fill many of these empty lines by settling for the lowest common denominator — often the media source level or even media source and campaign level — losing any meaningful granularity. That means the creative-level data in the example above won’t be leveraged to fully optimize the campaign.
What level of granularity is needed to push the needle? Your data should go all the way down to the creative, geo, site ID, and keyword level.
Furthermore, it’s important to stress that any change in the data requires heavy manual work. And even if you could match it with a full list, you would need to constantly build integrations per app, per network and per attribution provider —which is simply not realistic.
5 – Lack of data freshness
Having two providers means data is not updated constantly (daily instead of several times a day), while not taking historical data into account.
Beyond the specific problems related to attribution and cost data, there are challenges that surface in any marketing tech stack when working with additional tools.
Tool & SDK overload: You don’t need two tools when one can do both things. Working with two increases app size, and prevents marketing teams from operating more efficiently.
It also increases the tech debt. It’s much harder to maintain two SDKs and their codebase versus one. Last but not least, two solutions are more expensive than one (not to mention finance will not like you for that extra invoice to handle).
Heavy implementation and onboarding effort: As all marketers know, implementing and onboarding a new vendor, particularly in the field of analytics, is a major effort.
Any such effort requires you to harness R&D and BI teams when implementing such SDK and data integrations to your BI layer. The heavier the vendor the more dependent you are as a marketer on other teams.
Solving problems and fixing bugs: If there is an error of any kind, which vendor’s support team should you contact? Even if you could isolate the problem to one vendor, both still need to communicate to solve it. So how do you arrange that? Needless to say, this is a textbook definition of a nightmare scenario.
To read more about the complexities of measuring ROAS in a privacy-centric world, click here.
Key takeaways
- ROI is an elusive metric, as many marketers don’t realize their ROI data is inaccurate or incomplete, causing a bleeding cash cycle. Adding to this complexity, SKAN measurement adds yet another layer of data fragmentation, turning consolidation and standardization to even more of a challenge.
- Precise ROI for mobile apps is dependent on precise attribution data which ensures the accuracy of both revenue and cost data.
- Accurate attribution data is anything but trivial, and requires years of tech heavy-lifting to build a platform that can handle scale, integrate with the entire ecosystem, offer granular reporting, and ensure that sensitive data is held to the highest standards of security.
- True ROI can be achieved by an attribution platform that can collect, organize, and standardize all cost data from many sources through different methods of collection: API, file uploads, or via the attribution link.
- [Robust] Attribution & cost are better together to prevent data mismatches, sub-par optimization and data security risks.