
Introduction
Apple’s privacy-centric aggregated attribution framework SKAdNetwork (SKAN) is the new sheriff in town. With most iOS users denying access to their user-level data in versions 14.5 and above, you rely on SKAN to measure the success of their campaigns.
SKAN has turned mobile app marketing in iOS on its head, introducing completely new mechanisms to balance between data privacy and marketing measurement. At the heart of this new world order are sophisticated timer mechanisms, elusive privacy thresholds, and a unique conversion value system to grade the success of a campaign.
Since the introduction of Apple’s AppTrackingTransparency (ATT) framework in iOS 14, privacy-driven policies have taken center stage to eliminate bad practices surrounding user data. This is, without a doubt, an important step forward.
However, many challenges have also been introduced with the new frameworks, particularly the limited data provided by SKAN to optimize campaign performance.
AppsFlyer’s Inside SKAN guide uncovers insights and learnings from SKAdNetwork during this time of transition. We have a clear goal in mind — to help you navigate this largely uncharted territory so that you can drive sustainable growth and profitability for your business.

Publisher and advertiser app connections revealed
Which app categories advertise most and with what kind of publishers? Neither Mobile Measurement Partners (MMPs) nor ad networks have been able to independently answer this question.
Until now.
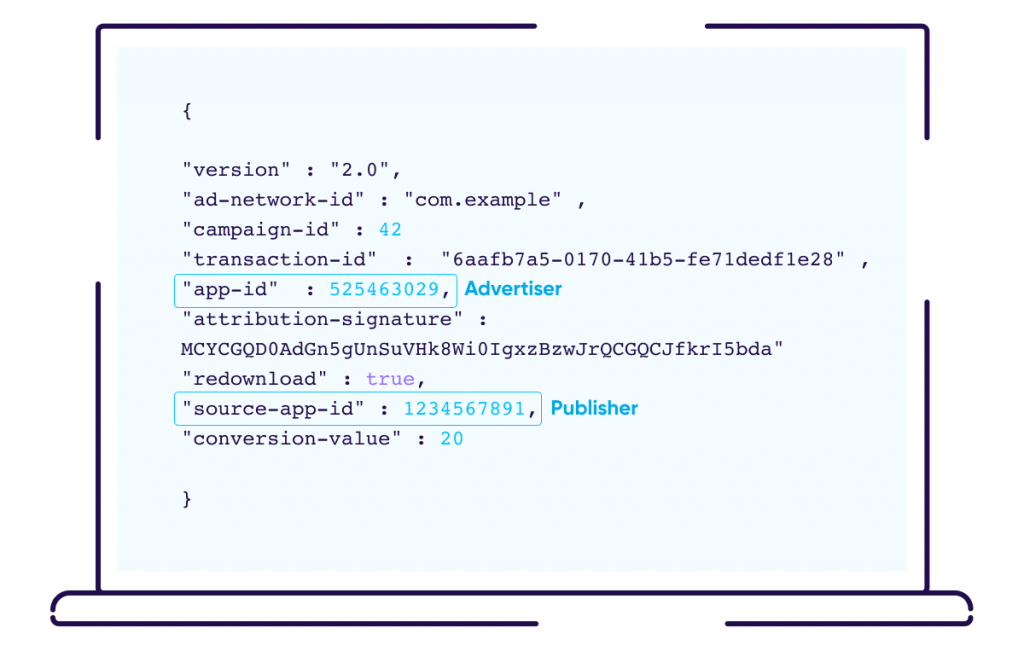
As part of SKAdNetwork — Apple’s solution for aggregated attribution post iOS 14 — new data has become available that enables the connection of data between advertisers and publishers for the first time.
Previously, the MMP and advertiser weren’t exposed to the Apple publisher app ID (this data isn’t available in Android either). But the SKAdnetwork postback includes the source-app-id. Now, with this new data, we can see how publishers connect to advertisers, and vice versa.
This data is extremely valuable to app marketers to inform targeting (especially in the age of privacy when data is limited and contextual signals become increasingly important), drive ad revenue (allowing publishers to prioritize categories and genres with high affinity to their own), and inform cross-promotion optimization, to name just a few key benefits.
In this guide we’ll uncover a world of insights from SKAdNetwork to help advertisers navigate this largely uncharted territory.
Sankey diagrams explained
A Sankey diagram is a specific type of flow diagram visualization, where the width of the arrow is proportional to the flow or value.
The easiest way to explain a Sankey diagram is to show you one, and to dig straight into the advertiser-publisher data from SKAdnetwork:
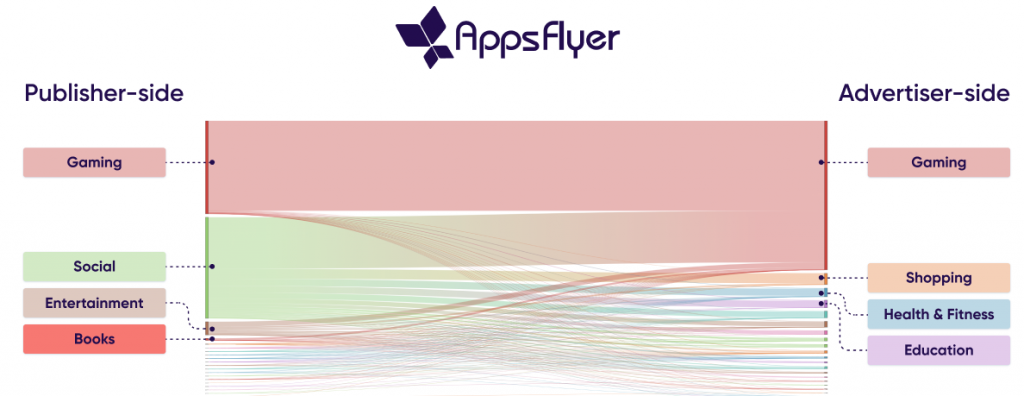
On the left side are the publisher apps, and on the right side are the advertiser apps, showing us which app categories connect, and to what extent.
There are three types of insights in these Sankey diagrams:
1) From left to right, or publisher app category to advertiser app category, we can see that 51% of installs driven by ads in Social apps were of Gaming apps.
2) From right to left, we can see that 35% of Gaming app downloads were the result of ads in Social apps.
3) Left or right side only shows distribution of each type; for example, 48% of paid app installs were driven by ads on Social apps (publisher side).
Key findings
The data is based on tens of millions of SKAdNetwork postbacks aggregated between May 10 and June 15, 2021.
1) Overall: Social and Gaming publishers reign supreme

On the publisher side:
- Ads on Social & Gaming apps drive 92% of paid installs: 48% from Social, 44% from Gaming.
This is no surprise considering a) the popularity of social network ad platforms among advertisers (Facebook, Snap, Twitter, TikTok etc. are all integrated with SKAdNetwork), and b) the sheer size of Gaming in the app space and their heavy use of advertising to drive both demand and revenue as publishers.
- More than half the installs driven by Social publishers are of Gaming apps. An additional 10% led to Shopping app installs, and 7% to Education as well as to Health & Fitness apps.
- A whopping 97% of installs driven by Gaming publishers are of Gaming apps. The appeal is clear, gamers play many games and are always on the lookout for the next game to play.
On the advertiser side:
- Gaming apps account for 70% of paid installs, with Shopping a distant second at 5%.
Gaming app marketers rely heavily on paid acquisition to drive demand. Because their space is hyper competitive like no other industry, they must spend money to make money and stand out.
As the savviest marketers, they also have confidence in their ability to leverage data to ensure their ad investments are profitable.
Get the latest marketing news and expert insights delivered to your inbox
2) Non-gaming publishers: Social apps command 86% share
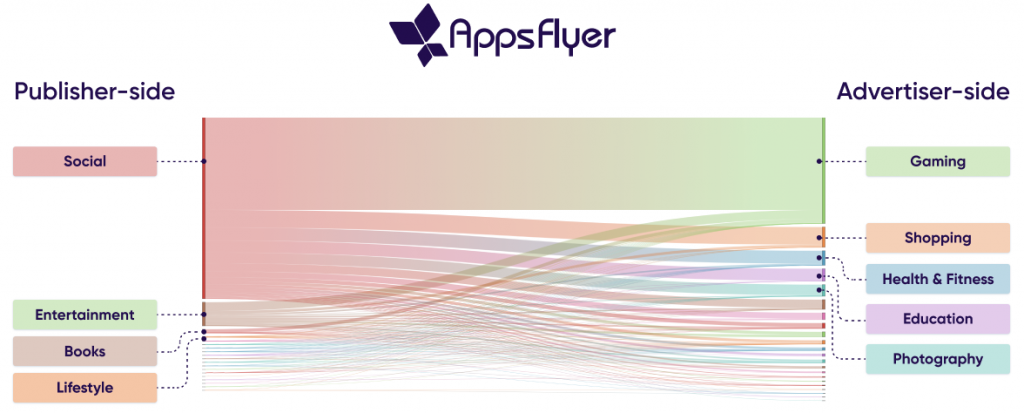
- When we exclude the massive source of Gaming apps as publishers, we can see Social take over non-gaming publishing with an 86% share.
- Although Shopping is the second biggest vertical, it is not used at all as a publishing platform. Given that the sole reason users browse Shopping apps is to buy goods, which of course is aligned with any brand’s goal, there is no reason to disrupt the flow with ads.
- Entertainment apps are the second largest publisher with a combination of streaming apps that often use ads as a revenue stream to complement/supplement subscription revenue, and the resemblance to Gaming in quite a few apps categorized as Entertainment in the App Store.
3) Gaming sub-category*: Revenue model determines publishing space distribution
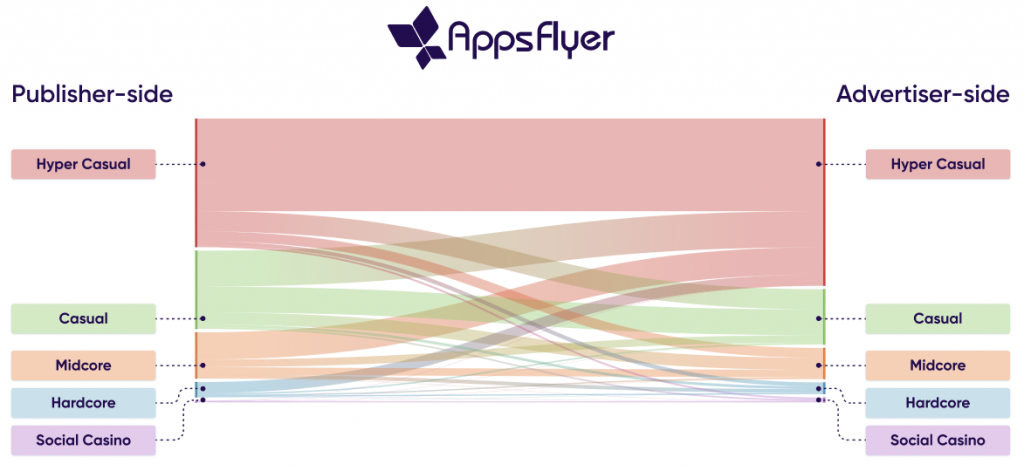
- Ads in Hyper Casual (HC) apps drive 48% of paid Gaming app installs. Since these games are completely reliant on in-app advertising (IAA) as a source of revenue, and because of their popularity, they dominate the publishing field among Gaming apps.
- The rest of the Gaming publishing space is also driven by the revenue stream: Casual games often have a mixed income from IAA and IAP (in-app purchase), while Hardcore and Social Casino are far more reliant on IAP revenue. It is also a question of size as these subcategories are far more niche and appeal to more advanced gamers.
Genre groupings were comprised of the following app store categories:
- Hyper Casual: Apps with at least 90% of revenue coming from ads
- Casual: Casual, Puzzle, Card, Board, Word, Educational, Trivia, Family, Sports
- Midcore: Adventure, Simulation, Action, Arcade, Racing
- Hardcore: Strategy, Role Playing
- Social Casino: Casino (not real money)
4) Gaming genre: Casual and Puzzle games hold a 45% share of publishing space
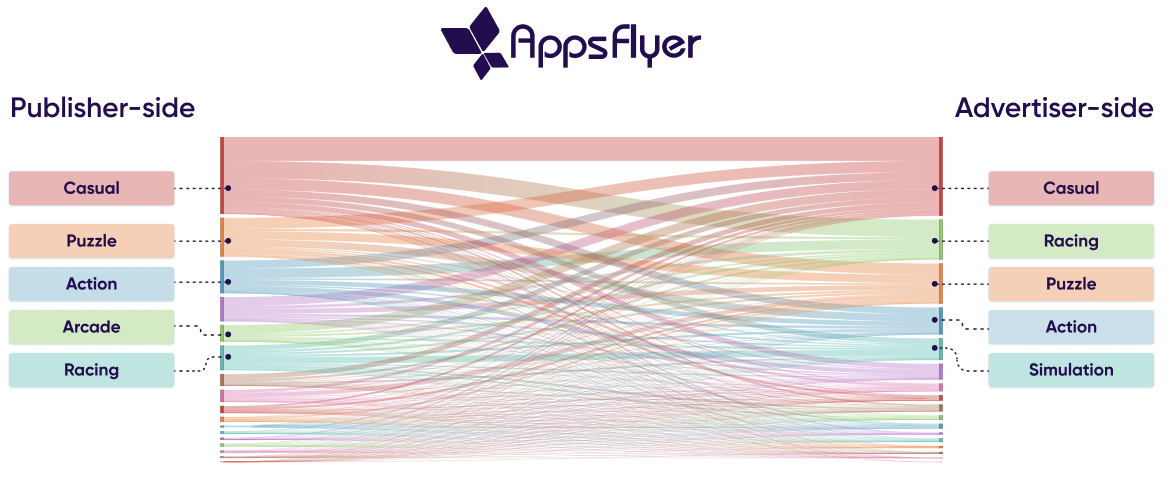
- A category level breakdown shows Casual apps driving 30% of paid Gaming app installs, followed by Puzzle at 15%. In this App Store-based categorization, Hyper Casual apps are included in Casual.
As explained above, these apps rely on IAA and therefore dominate the publishing space. Puzzle games are a form of Casual games as they are relatively simple to play and rely on a mix of IAA and IAP to drive revenue.
- Although Racing games are not major publishers, they do command 15% of the paid install space.
To summarize
- Thanks to SKAdNetwork, new data connecting publisher and advertiser apps has become available for the first time.
- Given the popularity and size of social network ad platforms and Gaming in the app space, ads on their apps drive the vast majority of paid installs.
- Because of their hyper competitive space, Gaming app marketers rely heavily on paid acquisition, accounting Gaming apps for the bulk of paid installs.
- Social takes over non-gaming publishing, with Entertainment grabbing second place.
- Shopping is not used as a publishing platform at all, despite being the second largest vertical, because ads tend to interrupt the shopping flow.
- Ads in HC apps dominate the publishing field among Gaming apps, primarily due to popularity and for being completely reliant on IAA-driven revenue.

May 20th and the curious case of the conv value null’s share
On May 21st, the share of conversion values (CV) with null entries in Apple’s SKAdNetwork postbacks changed dramatically.
While some media sources experienced a drastic drop in CV null values, dropping from a share of 80% to 20% over the course of one day, others demonstrated the opposite trend, displaying a spike from 0% to over 30% CV nulls:
The data, based on 47 million postbacks from 10 major media sources during the measured timeframe, suggests that Apple changed the logic that determines its privacy threshold on May 20th. As a result, an immediate impact on the CV null rates was seen the following day.
It’s important to mention that since Apple has yet to communicate anything regarding this matter, we can only make a confident assumption that this is indeed the reason.
In this chapter, we’ll provide our take on this dramatic shift, its potential cause, implications, and recommended action items for advertisers.
The likely culprit: Apple’s privacy threshold change
As mentioned above, we believe Apple updated its privacy threshold on May 20th.
But what is this elusive privacy threshold, you ask? Great question. In its documentation, Apple only states: “The postback may include a conversion value and the source app’s ID if Apple determines that providing the values meets Apple’s privacy threshold.”
What does meeting this threshold actually mean? We can only assume by connecting a few dots at this point. More on that a little later on.
There’s a strong indication that Apple’s privacy threshold is essentially an attempt to prevent any way of identifying or even coming close to identifying a unique user.
In an aggregated solution such as SKAdNetwork, the lower the number of postbacks, the higher the chances to identify a specific user. Therefore, when granularity is as low as publisher level on a per-day basis, it’s possible for only a small number of postbacks to be included.
In such a case, when Apple believes there’s a risk of identifying a user, it will mark all daily postbacks from that publisher as null.
Needless to say, this has massive implications for advertisers. Because it’s the only piece of data that is available on post-install activity from SKAdNetwork, it informs predictions of future value, and therefore campaign optimization. Without CV, advertisers are left with install data alone, which carries very little weight or value without the needed post-install data.
Why did some networks experience spikes while others sharp drops?
We believe this is because each network has its own internal logic when it comes to figuring out the privacy threshold. They offer their advertisers guidance accordingly; each with its own set of campaigns hierarchy, ad-sets, publishers etc., so any change, such as the May 20th event, can bring about significant differences between networks’ performance.
For example, an ad network with hundreds or even thousands of publishers will look at the data on a publisher level, which can include very few postbacks. Other media sources like social networks, analyze their data at ad-set level because they have just one or a few publishers.
Facebook, for example, has recently advised its advertisers that the privacy threshold, as it applies to Facebook, is 128 installs per day per campaign.
Overall, and beyond the fact that Apple limits SKAdNetwork campaigns to 100, undoubtedly a change in its own right, the privacy threshold creates added complexity for networks. Supporting this, several ad networks we’ve approached on the matter acknowledged the problem, and confirmed they were working to reduce their share of null values.
Fresh insights on Apple’s privacy threshold
To help shed more light on the recent privacy threshold modification, we compared the share of CV nulls with the number of postbacks per campaign, and then again with the number of campaigns.
The data presented is based on the DAILY number of postbacks per app, campaign, and network. It does not, however, include the source app ID dimension, which we believe is included in Apple’s logic. Since we don’t know which other factors are involved, these numbers should serve to highlight general trends rather than specific benchmarks.
The data above shows a clear correlation between CV nulls rates to the number of daily postbacks per app, per campaign, where the percentage of nulls begins a dramatic drop from 80% to 0% after exceeding 10 postbacks.
On the flip side, when we look at the CV null ratio compared to the number of campaigns, we can see that the percentage of nulls rises from around 10% to more than 30% roughly after 57 campaigns. Although this is not a consistent trend, evident by the sudden dips around 61 and 71 campaigns, it is an upward shift nonetheless.
Recommended next steps
- We recommend that advertisers revamp their campaign structure to favor a high volume of installs per campaign across all networks they advertise on, and follow network guidance where applicable (e.g. Facebook).
- It might be beneficial for networks to seek clarity from Apple, so that they can update their campaign taxonomy recommendation accordingly, but also receive a proper heads-up when logic or values are updated in the future.
- Advertisers should be agile in executing on recommendations such as campaign aggregation, moving away from hyper-segmented campaigns.
The final word
Privacy thresholds are an important component in today’s privacy-centric reality. Enhanced transparency about how, what, and when they are put in place can help marketers optimize their campaigns while persevering the new privacy standard.
To ensure maximal relevance, we’ll be sure to update the post as more information becomes available, and continue to closely monitor, analyze, and shed more light on this and future trends.

The story behind the low NOI figures (and some reassurances)
Mobile app marketers have had to rethink how to measure, attribute, and optimize their campaigns in the age of privacy. They’re struggling with the reality of having to determine their LTV and ROAS based on limited post-install data provided by Apple’s SKAdNetwork (SKAN).
But iOS 14 is also proving to have a negative impact on another key part of performance — the volume of non-organic installs (NOI) — leaving many advertisers concerned.
Indeed, according to our data:
The average app is experiencing a 37% drop in the number of NOIs attributed by SKAN compared to pre-iOS 14 attribution figures.
So if you’ve seen it in your app, know that you are not alone.
This analysis was based on a traffic comparison between July and February 2021, sampling the same apps and the same networks in the same timeframe. In other words, the combination of app and network had to appear in both timeframes for a valid comparison to be made.
6 reasons behind the NOI decline
1) Low SKAN version 2.2+ implementation rate leading to missed VTAs
Because view-through attribution (VTA) is enabled only on SKAN versions 2.2 and above, we’ve found that 22% of postbacks originating from these versions are view-throughs.
On the flip side, no less than 76% of postbacks came from SKAN versions that were below 2.2. In theory, up to 22% of these 76% could be VTAs that have not been recorded because of networks and publishers that do not support version 2.2+, and because of end users who did not update the publisher app version.
According to our data, 85% of publishers and 73% of networks have implemented versions 2.2+. However, this list doesn’t include several major players that are responsible for a significant volume of traffic and have yet to implement version 2.2+.
It’s also important to remember that it takes not two but three to tango.
That means that for a VTA to be recorded three conditions have to be met: both the network and publisher need to have SKAN version 2.2+, and in addition the end user has to have the updated publisher app version.

2) Some publisher apps have yet to implement SKAN
In order for a SKAN postback to be sent, three things need to happen:
- The ad network needs to sign the ad
- The advertiser app needs to update the conversion value
- The publisher app needs to trigger the SKAN flow
As we analyze only advertiser apps and networks, we still need publisher apps to play their part. We know that some of them have yet to implement SKAN, which is another reason that contributes to the NOI drop.
3) No web attribution in SKAN
The web is becoming an increasingly important touchpoint for app marketers because it is an attractive source for both acquisition and engagement with existing customers. According to our data, about 10% of installs have a web touchpoint.
However, SKAN does not support web attribution…
Furthermore, many journeys begin on Google Search which is also a web touchpoint. Although not the default search engine in iOS’ Safari browser, it still commands about 10% share of iOS installs from Google’s channels.
4) Self-attribution for non-consenting users no more
Prior to iOS 14, Self-Reporting Networks (SRNs) used to claim credit for any engagement as long as it was captured within their lookback window, regardless of the stage of the credited touchpoint in the funnel.
In the SKAN reality, however, SRNs get credited for last touch attribution just like any other media source. If they did serve the last touch, these networks would receive a postback indicating a win. If they didn’t, no indication of a preceding engagement is credited.
Clearly, there’s a delta here that advertisers see when comparing their SRN dashboards with SKAN traffic vs. pre-SKAN days.
5) Decrease in iOS budgets
Our data shows a drop of 15%-20% in iOS budgets, which also has an impact on NOI in specific and attribution in general. Having said that, the share of iOS budgets within the overall budget pie has only decreased by 10%.
This trend, however, is far from being consistent. While some companies have shifted their budget towards Android campaigns, others are continuing to maintain stable iOS-focused ad spend.
6) Industry wide performance and tech adjustments still WIP
The paradigm shift in the mobile app space cannot be overstated.
It requires heavy lifting on the tech side to build new models and new ways to optimize. But bear in mind this takes time and we are only a couple of months in.
In this transition phase, limited data means targeting and optimization is just not there yet, and as a result there’s a drop in traffic.
What you can do now
Despite the undeniable level of uncertainty, there’s still plenty that can be done during this transition phase to improve measurability and performance, whether driving traffic or securing high LTV and positive ROAS.
Here are a few next steps and recommendations you can put to use that can boost your confidence to invest in iOS campaigns:
- Make sure your publishers and networks upgrade their SKAN version to 2.2+. And if they’re not at all integrated with SKAN, make sure they do so as well. You’ll gain far more VTAs if more publishers upgrade.
- Know that 64 conversion value options are enough to measure ROAS and predict LTV. Although you do lose a degree of data richness, it doesn’t mean that you can’t build campaigns that target high quality users. There are ways to make these 64 options work for you, as Eran Heres, CTO at CrazyLabs said in our recent iOS 14 guide for Gaming app marketers:
“We’ve built our own model that is based on the prediction of a user’s in-app purchase revenue and ad revenue. By leveraging all 64 values we’re able to measure the ROAS and predict user LTV with good accuracy.”
In the context of sufficient data for predictions, a recent Deconstructor of Fun post written by Tiffany Keller, Director of Product at Sybo, commented that “saying VO bidding killed all the whales for Mid and Hardcore Gaming is like saying that within 24-72hr of installing, only knowing someone made a $15 IAP, but not that they also bought a $2 starter pack can’t give us a good prediction of the install’s general LTV bucket.”
- Leverage higher than anticipated ATT prompt opt-in rates for benchmarking. The share of consenting users is significant and higher than expected, which is good news not only for this cohort but mainly for the purpose of applying learnings and benchmarking to your non-consenting cohort.
- Bring users to your app from the web where the cost of media is cheaper and the transition from web to app can work like a charm, ensuring measurability is fully retained.
- Utilize accurate attribution while preserving user privacy. Use all available data points, but ensure compliance with the way the data is being shared with your partners.
- Find creative ways to increase your opt-in rates.
- Timing – Try to pinpoint the precise moment in your users’ journey to prompt the ATT dialogue, while creating different paths for existing and new users. Also, know that timing the ATT prompt to appear before the attribution SDK is triggered can have a major impact (180% higher IDFA rate), and in most cases, delaying by only a few seconds is all it takes.
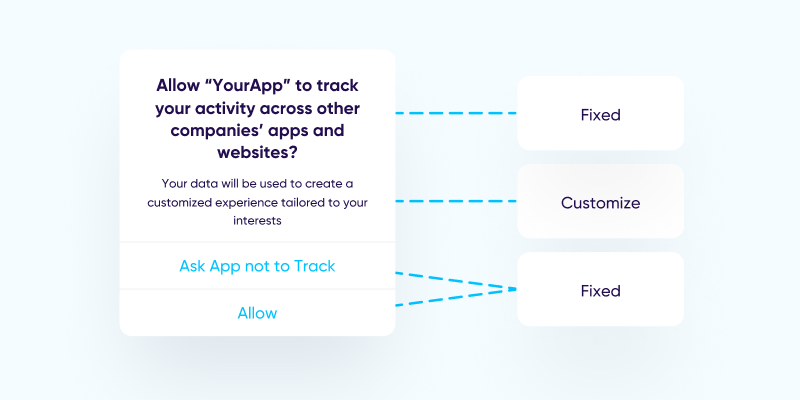
- Customization – The unbolded text in the ATT prompt can be edited so you can better explain why you want to capture the user’s IDFA.
- Pre-ATT prompt – Displaying a pre-prompt means you’re gating Apple’s ATT dialogue behind your own native prompt, enabling you to customize the design, timing, and messaging to best fit your app.
- Use IDFV across your apps to create a 1st party data powerhouse, and use existing audience segmentation integrations to communicate via in-app messaging and push notifications (mainly relevant for Gaming).
- Longer term solutions: Put incrementality and predictive analytics to use. These fields are currently being heavily-invested in by the entire industry, including attribution companies, SRNs, and ad networks.
Advertisers should follow suit and begin developing these capabilities by employing a data science team.
Although this extra step is not likely to address immediate pains, it will enable you to get more applicable data for internal predictions – a must-have in the age of privacy.
Summary and a few words of encouragement
1) The current direction of the privacy wave is pushing all industry players to rely more on innovation, data science, and integrations, all processes that take time to bear fruit.
2) Considering all the recently applied privacy regulations (LAT, GDPR, CCPA, etc.) we need to remember that the share of users who opted-out of tracking was not small even prior to iOS 14, especially in iOS markets, where LAT users were about 30%.
3) Aggregate data enables you to remain compliant with privacy rules, while conversion value management tools and predictive analytics give you the flexibility to make better decisions based on limited data.
The bottom line: Retaining volume and performance in the age of privacy is more than possible. It is only a matter of time.