

How to piece the measurement puzzle together


Remember that measurement in our day and age is all about the right mindset? But, even if we meet this new reality with a can-do attitude and a full intention to make the most of it, working with so many sources of data to evaluate our performance — makes things increasingly complex.
Today’s post is about understanding the specific value (and limitations) of each data source, and how to make the most of all in parallel: From piecing them together, to reading SKAN versus other last touch data, and ways to include top-down methodologies such as incrementality & MMM.
In other words, we’re going to break down bottom-up vs. top-down measurement, look into the pros and cons of last click vs. impact measurement, and how you could make the most of both.
Making sense of the various last-click data sources
SKAN, self-reported conversions from networks, Adservices, owned media deep linking, and your consented cohorts — are all last click, bottom-up methodologies. In some cases, you only get one, and in others you might have various at the same time.
So, how do you interpret the data coming from these last click data sources?
First, understand for which specific case each methodology applies, and what level of granularity it provides. Some sources provide exhaustivity — like total number of installs & events, other depth — including creatives’ data and events taking place after the first day, helping you build LTV curve.
Some even offer both, but not for all traffic sources. Let’s dig into the details:
1 – SKAN data is applicable for app-to-app campaigns only, in aggregate form, and without creative details.
Keep in mind that when operating at smaller volumes or across many publishers, the data might be partial given its likelihood of staying below the required privacy threshold — which will produce “null” conversions.
2 – Most ad networks provide self-reported conversions, allowing marketers to interpret data directly from their interface.
That said, be aware that many SRNs, including Meta & Google, include data modeling.
That means that the numbers you look at are extrapolated from observed conversion and what the network believes may have happened with more details. Their varying methodologies mean they are only valid within the environment of the network providing them.
Definitely use modeled data to complement other data, like the unbiased perspective provided by your MMP, but remember the network’s interests and yours might differ at times.
Get the latest marketing news and expert insights delivered to your inbox
3 – Apple Ads API (Adservices) gives you extended granularity down to the keyword level, enabling you to analyze all events, as well as a wealth of insights around LTV & retention in particular. But, this only applies to Apple Search Ads and lives in a separate environment to other methods.
4 – Deep linking also gives you depth of granularity when it comes to event measurement, but only apply to specific cases, such as your owned media and web-to-app.
5 – The consented cohort – When IDFA is available through opt-in, it’s a double edged sword: marketers can access granularity in full (including creatives details and post day 1 events), but only for a fraction of their traffic.
The double opt-in mechanism, on the advertisers & publishers side, makes it particularly tricky for marketers to evaluate their total volume of conversion on the one hand, while on the other — serving as an extremely useful tool to be able to gauge the quality of traffic coming from a specific publisher.
When discussing metrics within your marketing team or other stakeholders within your org, make sure you’re talking about the same thing!
Comparing CPI through Adservices vs SKAN is not apples-to-apples (pun intended). Their methodologies — e.g. different attribution window, volume thresholds, etc. — are so different, that they can’t be put side by side.
Expand your perspective

In some cases, you can get a better picture of your actual performance by using various sources in tandem. Let’s have a look at the case of a Meta campaign:
- Facebook provides you ad engagement metrics in detail, which are useful to understand how your audience interacts with your ads and if your messages resonate. This does not, however, inform you how your users convert later down the funnel.
- Self-reported conversions provide a rough idea around how conversions are distributed (even in the case of creatives), but they are heavily modeled and you might want to avoid comparing networks against each other.
- SKAN data available in your unified dashboard gives a more comparable measure of different sources, but lacks depth for creatives and events that take place after the first day(s).
- By being partial by definition, your consented cohort informs you less about quantity, and more about quality. You can interpret the behavior of some users with a lot more depth, like day 7 retention.
A unified view
This new measurement game is obviously more complex than what the all-in-one IDFA used to provide, especially as some sources might create duplicated data because of conflicting methodologies.
For instance, a user could have been attributed from a click on paid social, but then head to the online store and get counted by Adservices as an Apple Search Ads’ conversion.
A Single Source of Truth solution (SSOT) solves the SKAN reporting problem by flagging an existing, non-organic install record that’s attributed through SKAN.
This is done by using 1 bit of SKAN’s Conversion Values, which flags that an attribution exists and enables your MMP to deduplicate your SKAN installs and installs that have already been attributed by your MMP.
Incrementality & MMM – a complement to last touch

Every attribution methodology comes with its own set of trade-offs.
Bottom-up methods such as last-touch are extensively used for their granular upside, but might not be telling you the full story.
Some channels are inherently higher up in the awareness funnel and not drive as many instant conversions. Others are much closer to the decision moment, or located strategically within the store just before an install.
But this isn’t specific just to mobile apps. The same phenomenon exists on the web, where Pinterest could help increase awareness and consideration early on, while Search gets attributed with more conversions than it would have on its own, due to the very nature of ads’ placement.
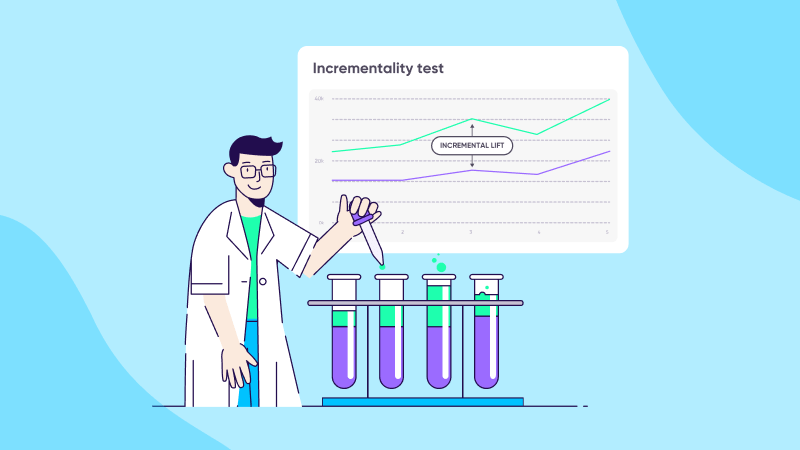
Incrementality & Media Mix Modeling (MMM) provide a complementary, top-down perspective to consider without having to rely solely on last clicks (and last impressions, in the case where view-through gets reported).
Both methods are using complex statistical models to estimate the impact of paid media, all while being personal identifiers-free.
In the case of MMM, intricate probabilistic models, based on multivariate regressions, consider large amounts of historical data — which may include ad spend, impressions, and blended installs & conversions — to infer what is influencing the performance of marketing spend.
It’s most efficient if externalities are baked into the data sources, such as competitors’ major changes, featurings, or even the weather at the time!).
guide
How to measure your app marketing’s true ROI
In some cases, MMM can uncover networks that are under-evaluated by last touch only, or even lacking a last touch altogether, such as TV campaigns.
Nothing is ever perfect, and among drawbacks, we can note that MMM only provides a view of the channel as a whole.
In other words, it informs about performance at a strategic level — e.g. is this channel actually helping sales? — but not operationally, so you wouldn’t know with granular details which creative or even campaign to iterate on.
MMM typically provides insights over a longer period of time, making it more suitable for a higher level of decision making & future planning.
MMM also requires huge amounts of historical data in order to perform properly, and wouldn’t be suited for cases like a new launch or smaller startups.
Incrementality measurement, on the other hand, achieves a relatively similar goal through a slightly different methodology, and overcomes some of the granularity limitations of MMM.
It can be supplemented by last-touch attribution, as well as the detailed changelog of a network — to extrapolate which elements have had a positive, incremental impact on conversions.
Incrementality helps marketers to understand if a particular source is cannibalizing others by attracting last-touch or even organic conversion to it.
In some cases, incrementality vendors are able to factor more granular changes than MMM, such as a shift in creative delivery, providing more operational insights to channel operators.
On the flip side, incrementality measurement may not always be able to provide conclusions with a strong level of confidence, depending on how big the impact is, which externalities were considered by the model, or potential coincidences taking place at the same time — which are hard to untangle.
Some incrementality providers tend to consider more comparative data, like looking at a separate region to establish comparison and measure the real uplift.
Don’t do this at home though. Building your own top-down statistical model is only possible for teams with extensive resources and profound amounts of the data, enabling them to reach the level of complexity required to be able to build such models.
Note that with the new limitations around user level data, the interest in these methods has spiked in recent times, as they aren’t dependent on IDFA nor cookies, and can measure activities that wouldn’t provide proper touch data (e.g. billboard, TV, podcast advertising, etc).
To each target its own weapon – Don’t shoot flies with a bazooka

On a battlefield, you wouldn’t deploy artillery, cavalry, and infantry in the exact same way while facing different opponents. It’s unlikely that one specialty would get consistent victories in every single battle.
In a somewhat similar manner, there isn’t a single attribution method that can provide complete insights for the purpose of evaluating your ad spend.
Neither MMM nor incrementality measurement will replace last-touch attribution. They are available as supplemental tools to help you understand your performance.
Just like the different last-touch methodologies allow you to answer different questions, MMM & incrementality are yet another weapon in the marketer’s increasingly complex toolbox.