

Introduction
Have you ever been in a maze, trying to figure your way out by taking lots of wrong turns on the way? Looking at things from the ground level makes it impossible to properly assess where you are and the best route from A to B, right?
But what if you could zoom out and get a bird’s eye view of the bigger picture in order to make sense of it all?
When it comes to data analysis, there’s a common misconception among marketers that the more reports they look at, the more extensive their insights will be.
In reality, though, quality is more important than quantity. We’re all drowning in data — the challenge is to block out the noise and focus on what’s relevant. When you know how to slice and dice your data effectively, you’ll have a much clearer picture of what’s working and what’s not.
And this is where cohort analysis comes in.
It allows you to find the most efficient route from A to B. How?
By looking at your marketing activities as a whole, while cross-referencing performance metrics that enable meaningful trends to rise to the surface. Trends that would otherwise go unnoticed, because up till now you’ve been looking at your data out of context.

Chapter 1
So what is cohort analysis anyway, and why should you care?
When we talk about cohort analysis, we mean the process of taking a large group of users (or customers) and breaking it down into smaller segments that have certain characteristics in common over a set period of time.
These characteristics could include a common region or language, preferred items, acquisition date, and just about any other variable you can think of.
In the realm of mobile apps, cohort analysis is a highly effective way to gain deeper insights into how specific groups of users engage with your app over time. It can even help you refine KPIs when measuring campaign performance.
Businesses often use cohort analysis to:
- Optimize user acquisition (UA) campaigns – by pinpointing which segments are underperforming and where you can make improvements.
- Improve user retention and lifetime value (LTV) – by re-engaging high-quality users and reducing churn.
A huge advantage of cohort analysis is the fact it enables you to compare “apples to apples” when it comes to identifying trends, making it a reliable way to monitor changes over time, without having to perform behavioral analysis on an individual user basis.
By looking at your data from different angles, you’ll be able to answer pivotal questions such as:
- Who’s engaging with your app?
- When do users usually churn — and why?
- How much of your revenue comes from new vs long-time users?
- When is the best time to re-engage your users?
- Which media source drove the most ROI-positive users?
Bear in mind that interpreting all this data can take some practice: you need to know what you’re looking for, and where to look. See chapter 3 for some practical examples to help you make sense of it all.
Double whammy – the two main models of cohorts
You can define your cohorts any way you like, but the most commonly used types are UA and behavioral cohorts. Let’s find out what these look like and how you can apply them to your day-to-day marketing activity.
User acquisition (UA) cohorts
Acquisition cohort analysis is the bread and butter of advertisers and UA managers.
It involves segmenting users based on acquisition date and source. Depending on your product and analysis needs, you can do this on a daily, weekly, or monthly basis.
For example, you can create several cohorts based on different regions, and compare the average number of sessions per user for each cohort, over the first 30 days of each user’s activity.
Let’s say you’re the UA manager at an eCommerce app. You can use cohort analysis to track the style and size preferences of different demographics of users, and build your inventory accordingly to maximize sales. It can also help you create targeted recommendations and personalized promotional offers, which will improve customer trust and build loyalty.
Behavioral cohorts
If you’re a product manager rather than a UA specialist, you’ll probably be more interested in behavioral cohorts.
This type of cohort analysis focuses on users’ actions that take place in your app. By using special event triggers, you can gauge the behavior of demographically different users, and optimize and personalize your campaigns accordingly.
For example, let’s say you have a food delivery app: you could set up behavioral triggers for choice of cuisine and ordering frequency. Or, if you run a social media platform, behavioral cohorts could help you gauge the most followed pages by your Spanish users, or the most liked posts by your Indian user base.
But still… Why should you care?
In short, cohort analysis is your secret weapon when it comes to optimizing campaigns and boosting engagement.
It’s only when you hold up your performance metrics side by side like this — comparing apples to apples — that the trends and patterns come to light. With the insights you gain, you can sharpen your strategy and make real-time changes that improve growth and retention.
Take ARPU (average revenue per user), for instance.
It’s not enough to just compare one day’s ARPU to the next, as we need to account for all the noise and filter it out. Instead, you should compare ARPU on similar days of the week, compare the number of users, activity, and whether or not there was a promotion that could have driven more in-app purchases.
Armed with that information, you can adjust your strategy to increase revenue.

Advantages of cohort analysis
Wondering how cohort analysis can help you up your marketing game? Here are six ways you can put this technique into practice:
1 – Maximize your ad spend through actionable insights
Cohort analysis helps you figure out which channels, campaigns, or even ad sets within a campaign yield the best and most loyal users.
For example, by comparing the performance of a specific UA campaign across different regions, you can easily identify that a certain region is under-performing. You can then try out a few tactics to improve conversion in that region, like personalized emails that include a special offer or a coupon code in honor of a local holiday.
2 – Fight fraud
Mobile ad fraud can leave a gaping hole in your advertising budget. Going back to our regional cohort analysis, you might find that one region shows a high number of app installs, but barely any app launches and zero purchases. This pattern should ring alarm bells: it could indicate fraud, and a mobile measurement partner can help you get to the bottom of it.
3 – Discover the best time to re-engage
Seasonality and timing play a big part in the success of your marketing efforts. You need to be able to answer the question: “What’s the best month, day, or time for me to engage my users?”
For example, cohort analysis might show you that user spending plateaus around day 4 in a certain region — making that the perfect time to schedule a remarketing campaign. In some cases, every hour counts, and cohort analysis can guide you in creating superbly-timed campaigns.
4 – Boost retention with a smoother user journey
Put cohort analysis to use to uncover pain points in your onboarding, during first steps, on paywalls, or on challenging levels. By cross-referencing these churn-prone areas of your app with monthly user retention, you can see if users are dropping off at a specific point — and then take action to fix it.
5 – Understand how product changes affect your users
When you want to fix an issue or improve a feature in your app, don’t base your decision on guesswork.
Cohort analysis can help you with A/B testing: experiment with different features for different cohorts, and see which works best. That way, you can roll out data-driven changes rather than trying to force something new on your users without knowing how they’ll respond.
6 – Tailor your offering
When you offer the right products and promotions to the right customers, they’re more likely to buy. Here again, cohort analysis is your friend.
For example, you might find that people who install your fitness app in January are more interested in weight-loss workouts, whereas those who install in June prefer mindfulness. So, you can highlight the most relevant content to each group.
Or perhaps you sell groceries, and cohort analysis reveals that your vegan range is most popular with the under-25s. In that case, you could target that demographic with an offer on dairy-free treats.
To learn more about the science and art behind a bullet-proof app engagement and user retention strategy – see here.

This is how we do it – 3 practical examples of cohort analysis
Example #1 – Assessing the success of a multi-regional remarketing campaign
Campaigns can be localized to a specific region for a more personalized user experience. For example, a weekend-themed shopping campaign may run in the US on a Friday afternoon, but on a Thursday in Egypt (where weekends start on a Friday).
When it comes to shopping, remarketing campaigns usually include KPIs such as number of users who made an in-app purchase, purchase revenue, or percentage of re-engaged users. But cohort reports can give you a fuller picture of user behavior, KPIs, and success metrics.
For this example, imagine you’re the UA manager for a shopping app. You ran a remarketing campaign across multiple English-speaking countries, and now you want to find out how many of those users actually completed a purchase. Then, you’ll group results by country to work out where the campaign was most successful.
Making sense of the data
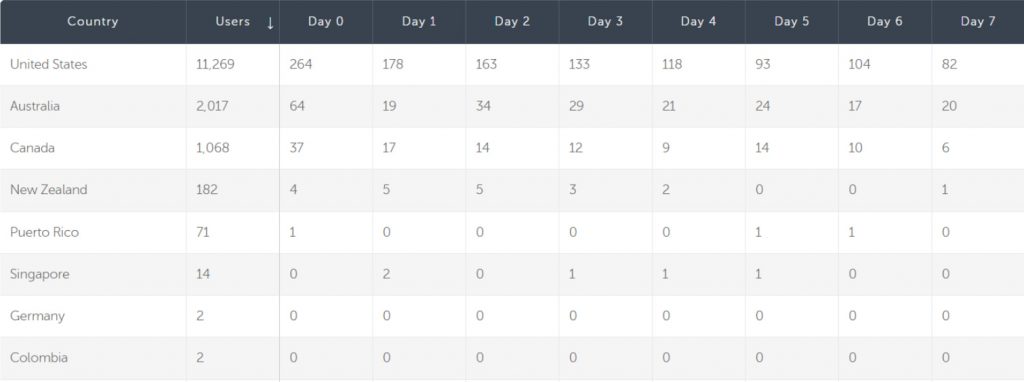
From the chart, you can see that roughly 80% of the 14,000 users who re-engaged with your app after the campaign were in the US, and these users also made the most purchases.
However, a closer look at the cohort report brought up an interesting trend. The “Sum” view (below) reveals that while users from Canada showed half the number of engagements that users in Australia did, Canadian users spent far more money than their Australian mates.
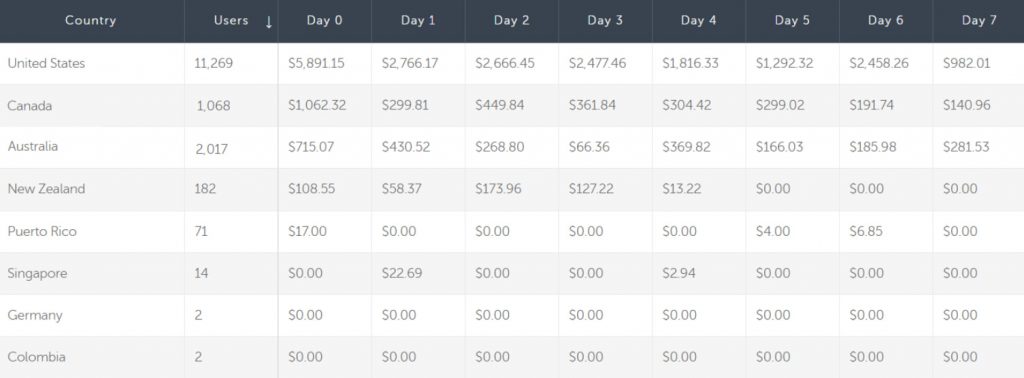
So, by looking at the same data set from a couple of different angles, you can identify that while Australia delivered in quantity, it didn’t deliver much in revenue. Knowing that, you can double down on the Canadian campaign with confidence.
Example #2 – Assessing the ROI of media sources for ad revenue
Gaming apps have two main streams of revenue — in-app purchases and in-app advertising — which are a critical source of income for hyper-casual games in particular.
Providing insights on all revenue streams, cohort analysis can answer questions such as “Which media source drove the most in-app purchases?” or “Which campaign produced the highest revenue per user in Mexico?” and so on.
Let’s say you’re the PPC manager of a hyper-casual game that relies on ads as its main revenue stream, and you want to know which media sources are driving the most ad revenue.
The ad revenue report will provide you with a full view of the ROI of acquiring new users – for example:
- $88,594 was spent on advertising on Media Source 1, acquiring over 586k users, showing a slow and steady incline.
- Media Source 2 was significantly cheaper, but brought in more revenue from ads than Media Source 1.
- An alternate view shows that Media Source 2 breaks even around Day 12, whereas Media Source 1 is still far from it.
In this case, cohort analysis shows you that no matter how much you zoom out, Media Source 1 will still perform at a loss, so you can allocate your precious budget accordingly.
Example #3 – Assessing retention according to an in-app event
Apps that provide an on-demand service, such as ride-hailing or food delivery, often have success KPIs that relate to in-app events. Downloads are a critical component, of course, but actually using the service is a much better indicator of successful conversion and retention.
Looking at retention gives you an overarching view from engagement to use. It shows you which media sources drive more engaged users over time, and how well your app maintains an active user base.
Imagine you’re the marketing manager at a taxi booking app and want to assess the success of a certain campaign based on how many new users booked a ride after downloading the app.
You notice that Media Source 1 shows more downloads — but, when you look through to day 10 post-install, you discover that Media Source 2 actually brought in higher-value users and increased retention, making it more successful overall.
By analyzing user behavior both on install day and over time, you get a clearer image of the retention success of that campaign per media source.
Get the latest marketing news and expert insights delivered to your inbox

4 steps to ensure your next cohort analysis is a raging success
Step 1: Determine the right set of queries
Defining your KPIs and success metrics will steer you in the right direction, so first things first: let’s establish what it is you’re looking to find out.
Do you want to measure campaigns side-by-side to compare media sources? Or measure the success of the same campaign across different regions? How do you define success, anyway?
Be sure to nail these questions down before diving into the next step.
Step 2: Define your metrics
As soon as you have solid ideas around the questions you need answered and the metrics you’ll need in order to answer them, you’re halfway there.
Here’s a handy formula for cohort analysis questions: Group users with similar characteristics to compare their behavior and metrics over a specific time-frame.
| Characteristics | Performance (KPIs) | Time-Frame |
| Country | Sessions per day | Last month |
| Media source | Revenue per user | 3 weeks ago |
| Ad campaign | In-app events per user | 5 days in June |
The characteristics are the dimensions by which you’ll measure your outcome. The KPIs are the actual metric you’ll be analyzing, and the time-frame will set the window for your measurement.
To learn more about app marketing KPIs – see here.
Step 3: Define the specific cohorts
This is where we get down to business.
Now’s the time to:
- Set up your granularity, date range, and attribution period
- Select the cohort type (like UA or remarketing), and trend type (for example, LTV)
- Select your grouping dimension (such as media source), and minimum cohort size — to avoid cluttering your report with insignificant data
- Select any additional filters that might be of relevance (examples include campaign, attribution touch type, country or keywords)
Step 4: Run a cohort analysis and evaluate results
Go, go, go!
Keep in mind that looking at siloed reports can’t give you the full picture or actionable insights, so don’t forget to slice and dice your data to unearth interesting trends, like app downloads vs ROAS across various regions.
To dive a little deeper into how to set up a cohort report in your AppsFlyer dashboard – see here.

Key takeaways
- Cohort analysis is the process of taking a large group of users (or customers) and breaking it down into smaller segments that have certain characteristics in common over a set period of time.
- By comparing “apples to apples”, cohort analysis gives you a fuller picture of your marketing success and how specific groups of users engage with your app over time. These insights help you refine your strategies to boost revenue.
- You can use cohort analysis to optimize UA campaigns, as well as to improve retention and LTV. Depending on your goals, you may want to analyze UA or behavioral cohorts.
- Once you know what to look for and how to look at it, cohort analysis reports will give you all the data you need to answer your UA and retention questions.
- The insights you gain from cohort analysis can help you better allocate your marketing budget, tailor your offering, and time your campaigns for maximum engagement. They can also shape a better user experience and help fight fraud.
- Situations where you might use cohort analysis include assessing regional campaign success, comparing ROI across different media sources, and assessing retention through in-app events.
- Before you run a cohort analysis, you need to define the question you’re asking and the metrics you want to look at. Then, define your specific cohorts, run your analysis, and evaluate the results.