
Top 5 data trends of 2023 and what’s in store for 2024


In the last three years, mobile app marketers have been on a wild roller coaster ride: covid, post-covid, iOS 14.5 privacy-driven data restrictions, the rise of AI, and a global economic downturn whose effects were felt in 2022 and 2023.
As a result, the ability to drive consistent growth through constant change has been, and will continue to be, a major challenge as we head into 2024 with more significant changes on the horizon. Here’s what the data* tells us from a tumultuous 2023, and what we can expect given these trends in 2024.
App install ad spend declined 6% in 2023 to $82 billion
The economic downturn had a significant impact on mobile apps’ user acquisition budgets in 2023, which declined by 6% year-over-year to reach $82 billion worldwide (see methodology at end of post **).
The drop was largely driven by a 10% decrease for Android, while iOS actually grew 2%. That disparity was even more glaring over the last three months (Sep-Nov) of each year, where we saw iOS budgets growing 7%, while Android budgets dropped by 8%.
From a vertical perspective, a 10% YoY drop was recorded in the UA budgets of non-gaming apps, driven by cuts in the top 3 categories: shopping, finance, and entertainment. During the same time, travel and lifestyle apps saw spending increase significantly.
UA spend by gaming apps in 2023, on the other hand, remained at roughly the same level as last year, but once again platform and time tell very different stories. Android budgets stayed relatively similar, while iOS increased 3%, but the trend in 2023 reversed: whereas in 2022 spend increased from May to November, in 2023 the opposite occurred — particularly in the last three months where we saw a significant 13% cross-platform loss: 17% drop on Android and 8% on iOS.
Gaming studios started the year with heavy spending, but as the year progressed there was a substantial drop in spending as cash reserves started to dry up. Between July and November 2023, gaming apps’ spend dropped 10% compared to February through June; whereas in 2022 it was 9% higher.
Within gaming, casual games (includes puzzle, party, action, match, simulation, tabletop, and kids genres) reaped much of the rewards as they generated more revenue (see trend #4 below), eating away at budgets of other genres. Hypercasual games took the biggest hit, with a drop of 30% — with a 13% surge in their share of the app install ad spend pie.
Hypercasual games suffered losses as a decline in their LTV and ARPPU was higher than the drop in cost per install. With their slim margins, this model was no longer viable for many such games. This precipitated a shift to a more hybrid, casual style model, with a push to drive revenue from in-app purchases to make up for losses in ad revenue.
What’s in store for 2024
With significant changes continuing to shape the ecosystem, there is still plenty of uncertainty heading into 2024 on multiple fronts: from a 1) macro perspective and potential economic recovery, 2) the digital marketing industry which continues to grapple with privacy-driven signal loss since iOS 14.5, and ahead of the release of Android’s Privacy Sandbox and Chrome’s planned cookie deprecation, and 3) AI which is of course a positive disruptive change but has the potential to radically change how businesses operate. These factors, particularly the state of the economy, will play a key role in budget allocation in 2024.
The good news is that many economic parameters like GDP growth, inflation, and market performance are in a far better place than they were in 2022, giving us room for cautious optimism that can very well lead to an increase in app install ad spend budgets in 2024.

iOS non-organic installs rebound with 9% YoY increase
After a 15% drop in the number of iOS non-organic installs (NOI) in 2022 compared to 2021 – when shockwaves of iOS 14.5 were still being felt – 2023 saw an impressive rebound with a 9% year-over-year rise, three times higher than the 3% increase recorded in Android.
There are two main reasons for the turnaround: there was a 10% reduction in the cost of media on iOS (as seen in cost per install figures) — in stark contrast to the 15% surge in 2022 which limited the volume of installs marketers could buy. There has also been improved adaptability and know-how among marketers, ad networks, and MMPs to the massive changes brought about by ATT and SKAdNetwork and the loss of data signals for optimization. All in all, efficiency improved significantly.
The iOS rise is driven by non-gaming apps which climbed 19% YoY (vs. a 4% drop on Android), while gaming apps’ NOIs remained relatively unchanged (vs. an 8% rise in Android). Having said that, the fact that gaming NOIs on iOS did not grow was still a major improvement compared to the 9% drop in 2022.
What’s in store for 2024
The economic downturn will heavily impact mobile app marketers’ ability to drive scale in 2024. As mentioned above, there’s some room for optimism.
Beyond that, significant changes in the ecosystem make forecasting even harder. With iOS, it’s likely we’ll see continued growth, especially with the major enhancements in SKAN 4. However, at present (end of November), its adoption has only reached 21% (share of postbacks), but we expect it to reach critical mass in Q1 after the leading media sources complete their implementation.
But while SKAN 4.0 represents a positive step forward, it still grapples with many issues particularly when dealing with incomplete or unavailable data from SKAN. The use of a single source of truth (SSOT) to de-duplicate multiple iOS data sources will drive higher NOI figures and more efficient budget allocation with more installs attributed to marketing, lower effective costs, and near real-time insights (instead of waiting for days for input).
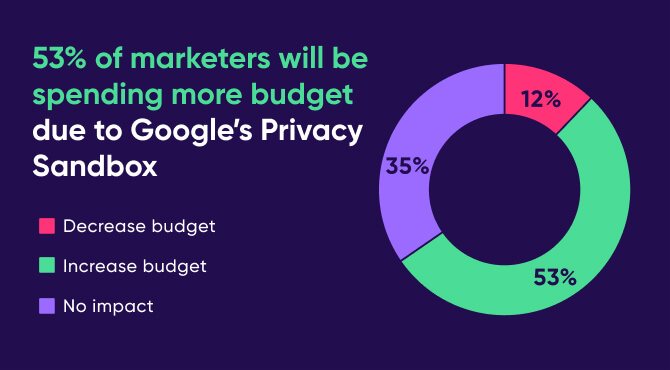
On the Android front, 2024 is the year of Privacy Sandbox. A complete overhaul to measurement on Android will have a profound impact on NOIs. Therefore, marketers need to educate themselves about Sandbox and prepare their systems. As we’ve seen with the rollout of iOS 14.5, such massive changes can take at least a year to prepare for, figure out, and ultimately drive positive business outcomes. It’s therefore absolutely vital to get ahead of the curve now and in early 2024. We’ve outlined the roadmap to Privacy Sandbox success here.
Most marketers seem optimistic about Sandbox, at least according to a recent survey we held among 150 of them:
In-app purchase revenue in non-gaming and gaming up 19% and 11%, respectively
In-app purchases in gaming apps rebounded from a 2022 slump, increasing 11% in 2023, driven by gains in casino and casual games — both of which saw their iOS numbers rise significantly. Unlike all other genres, Midcore games experienced slight declines which may indicate that the economic slowdown is limiting consumers when it comes to higher IAPs in these games.
Ad revenue or in-app advertising (IAA) revenue in gaming increased 4% YoY driven by significant gains in casual games (includes puzzle, party, action, match, simulation, tabletop, and kids genres), mostly at the expense of hypercasual games whose sole source of revenue took a hit in 2023 (21% plunge in Android and 10% drop in iOS).
Although the results in casino apps were significant, this genre only accounts for 3% of total ad revenue, compared with no less than 63% for casual and 28% for hypercasual. Midcore’s share in IAA is also low at only 4%.
Among non-gaming apps, we can see IAP consumer spend, which includes subscription revenue, surged 19% YoY driven by major gains in travel, food & drink, utility & productivity, and lifestyle apps, to counter the losses among the two largest categories in non-gaming: shopping and finance which also were at the top of the categories who cut their ad spend this year. IAP revenue includes subscription revenue, which in itself jumped 30% in 2023 to become a key revenue stream for non-gaming apps.
Marketers are putting a lot of effort into improving ARPU — a success seen by the higher increase in revenue compared to installs. In gaming, where marketers have always been savvy and are just getting even savvier (for example Monopoly Go monetization mechanics — complex as ever but also smarter as ever), while many non-gaming apps have finally caught up on why it is so important, using various revenue and paywall optimization tools as standard practice).
What’s in store for 2024
App monetization remained robust this year across IAP, IAA, and subscription revenue streams, showing consumers are continuing to spend money in apps despite ongoing economic and advertising industry uncertainty. As economic signs are improving, this trend is therefore likely to continue in 2024. It should also offer confidence for marketers who are holding back on spend. Furthermore, we expect more apps to adopt hybrid monetization with gaming combining mainly IAA and IAP and non-gaming mainly IAP and subscription revenue.
Android remarketing conversions down 9%
Non-gaming remarketing conversions on Android dropped 9% YoY in line with the budget decreases in app install ad spend (see trend #1 above) due to the economic downturn.
On a regional level, the drop was largely driven by declines in the two largest markets by volume of remarketing conversions: India and Brazil. In India, losses occurred in shopping and heavily in entertainment apps, and despite gains in finance and food & drink. The use of remarketing in the US actually increased due to gains in entertainment, finance, and food & drink apps, and despite a decline in the largest vertical — shopping.
Gaming remarketing actually enjoyed a 34% surge but it should be noted that this activity represents only a fraction of overall remarketing and a very small percentage compared to the use of UA in gaming.
What’s in store for 2024
As we move from advertising-ID-based remarketing under Privacy Sandbox to remarketing using the new Protected Audiences API, we are confident that remarketing will have successful continuity thanks to this robust solution. Having said that, it is a disruptive change so marketers will have to form different strategies and ensure they are well educated about what’s needed for a successful transition.
On the iOS front there’s also the expectation of a proper solution for remarketing without IDFA under SKAN 5, which may be released early next year. It appears that it will only support re-engagement with users who have an app installed, not those who have deleted it. It’s not currently clear how this will work, but it appears that Apple will develop a framework that’s similar to the Protected Audiences API.
It will be interesting to see if the Protected Audiences API and SKAN 5 will lead to increased confidence among marketers as to the prospects of remarketing in the age of privacy-led data restrictions.
All in all, it appears that remarketing is set for a strong(er) 2024.
Total app downloads increased only 2% in 2023 after a 10% rise in 2022
The total number of mobile apps that users downloaded in 2023 increased by only 2%, compared to a 10% rise in 2022. This was largely the result of a 4% decline among non-gaming Android apps, which is the largest among other category/platform combinations.
The drop was driven by declines in the largest three markets for Android non-gaming apps outside of China: India, Indonesia, and Brazil. This was despite a 6% rise in Android gaming installs (driven by gains in India, Brazil, Russia, and Indonesia) and a 7% uptick in iOS non-gaming (the result of gains in Russia and the UK, as well as in Thailand and Vietnam with surprisingly high iOS volumes).
What’s in store for 2024
With Android Privacy Sandbox, there may be a period of adjustment that will reduce the volume of overall Android installs, which make up the vast majority of global app downloads. Additionally, Apple announced it “expects to make” App Store policy changes to comply with EU’s Digital Markets Act (DMA) in the form of allowing new iOS 3rd party app stores. This change can generate massive impact in Europe since reduced store commissions can provide more viable business for app developers.
Bonus: Mobile app installs from CTV leaps 9x, average per app figure climbs 2.5x
Over the past eight months, we saw a dramatic surge in the adoption of CTV advertising by app marketers for the purpose of driving app downloads. Between February and September, attribution from CTV to mobile soared, jumping 9 times.
This momentum is especially evident when we look at the average per app figures. The numbers here demonstrate that the rise in usage is seen across the board, across most apps. Despite the slight drop in July and August after a nearly 2x surge, the average number of installs attributed to CTV bounced back, rising 20% by October and 2.5x since February.
Significantly, this growth trajectory is consistent across both gaming and non-gaming sectors. With TV now a measurable, affordable performance channel, the appeal for performance app marketers is clear.
CTV Performance is also promising: when examining non-SRNs, day 30 retention figures favor CTV-to-mobile attribution compared to mobile only users, with an 8-10% edge. This is particularly significant in the gaming apps sector where non-SRNs have a much larger share.
What’s in store for 2024
With promising results in CTV-to-mobile attribution, and the expected acceleration in CTV advertising in 2024 with the launch of an ad-supported tier on Amazon Prime Video (eMarketer predicts YoY growth to increase next year to 22.4%, from 20.0% in 2023), this up-and-coming channel for mobile app marketers is headed for continued growth.
* Sample size: 30 Billion installs from January 2022 through November 2023 among 40,000 apps; all results are based on fully anonymous and aggregated data. To ensure statistical validity, we follow strict volume thresholds and methodologies.
** App install ad spend as measured by all mobile measurement partners based on an industry wide extrapolation of 3rd party estimates.
- Spend in the non-attributed market (marketing driven installs that were not measured by one of the major MMPs) – estimated at 5%-10%.
- Spend in China was estimated based on data.ai’s figure of 110 billion installs in the market in 2022 as well as the share of non-organic installs and CPI data.
- The predictive model was primarily based on historical data, which included over 85 billion non-organic installs and $60 billion in ad spend between January 2020 and May 2023, as well as external analyst estimates pertaining to financial recovery.