
Mobile measurement & marketing analytics for Shopping apps – The complete guide

INTRODUCTION
The pandemic-accelerated rise of mobile, coupled with more products and services ever available, demand from shoppers has driven brands to emphasize mobile commerce, on-the-go and at user’s fingertips whenever the need to buy arises.
In fact, rising time spent on mobile will trickle heavily into shopping in 2022, with 85% of mCommerce sales predicted to come from smartphones in the US alone.
However, despite the explosive growth of shopping in apps, there are still retailers who have yet to focus their attention on this key touchpoint, thinking that a mobile website suffices. But since it has become a significant part of consumers’ shopping and buying patterns, retailers must get their mobile app strategy right so they can drive:
- Brand loyalty (think home screen icon)
- Engagement (through push notifications)
- Sales – a CX-driven native app experience is a powerful conversion enabler with a 3x higher conversion rate compared to mobile web (among retailers that have both, according to Criteo).
Mobile retail apps are no longer a nice-to-have, but a critical piece of the puzzle and an integral part of the customer lifecycle (more than 40% of consumers are mobile-engaged), for any national retailer trying to connect with its audience and deliver healthy bottom-line results.
Top challenges

While shopping apps can play a key role in driving brand loyalty and sales, there are also a few challenges to overcome:
- Securing app loyalty and multiple purchases in a highly competitive market
With so many eCommerce and shopping brands available, a user has nearly unlimited options for purchasing a single product. What’s more, the worldwide shopping heavyweights like Alibaba and Amazon increasingly dominate the market.
And although common retail marketing methods such as offering discounts or deals to users may be effective in acquisition, they don’t necessarily guarantee loyalty or a steady stream of revenue.
- Mobile measurement in the age of privacy
Over the past few years, privacy has taken center stage in mobile app marketing, and particularly for iOS (Android’s changes are at least two years away).
Apple’s introduction of the ATT prompt, which severely limited the usability of its unique identifier, the IDFA. As a result, user-level data has become much less readily available.
App owners can now turn to a host of new and not so new solutions to be able to regain granular, actionable insights. These include:
- SKAdNetwork – Apple’s deterministic aggregated attribution solution. Within this framework, SKAN conversion values allow marketers to to grade user value after the install.
- User-level deterministic attribution – ATT opt-in rates are around 47% for many shopping apps, which not only enable full data granularity for these users, but also the ability to segment towards non-consenting audiences.
- Aggregated probabilistic modeling – a statistical technique that leverages machine learning to estimate campaign performance with a high level of accuracy.
- Predictive analytics – allows marketers to make data driven decisions about users’ future value with a high level of confidence, while relying on very limited data points early in the funnel.
- Top-down measurement – holistic methodologies such as Incrementality (identifying incremental revenue drivers in order to optimize budget allocation), and media mix modeling or MMM (measuring the impact of campaigns to help determine how various elements contribute to the bottom line).
- Data Clean Rooms – enabling privacy-compliant measurement and optimization in a highly secure, permission-only environment where advertisers can leverage user level data insights without access to user level data.
These privacy-centered changes have a direct effect on marketers’ ability to measure LTV, remarketing campaigns, and segment audiences. Luckily — innovation is continuing to lead the measurement front with confidence, as data shows it has been largely restored to pre-ATT levels.
Fraud
According to AppsFlyer data, the average fraudulent install rate stands at 11% (as in 11% of shopping app installs are in fact fake), while financial exposure in shopping apps alone is a staggering $2.1 billion.
Personalization
Driving ongoing conversions and multiple purchases is largely dependent on a personalized user experience. This can be done through deep linking, push notifications, and targeted advertising with promotions or discounts.
However, while the reward of converting shopping users is very high, marketers must balance between respecting user privacy in the era of ATT and GDPR, while meeting user expectations of a personalized app experience.
Connecting the dots
The journey of a shopping consumer often spans across multiple devices, platforms, and channels — given online and offline ad exposure and the availability of multiple touchpoints.
A single purchase might start in-store, be researched further on the web, and bought in an app later –- and that’s only one example.
Therefore, connecting the dots between these different touchpoints and making sure you’ve linked the right data to your app — can be a real challenge.
Working with an effective attribution and measurement provider can help bridge the gap to significantly improve the user experience, attribute marketing’s contribution, and ultimately increase your LTV.
The solution: Granular measurement as a foundation for… everything
One golden truth of app marketing is that there are no strategies and processes without measurement and optimization, not only of basic KPIs, but also granular metrics. These allow you to map every stage of the conversion funnel to inform both user acquisition and re-engagement. In turn, you’ll be able to hone in on the users you’re looking for and uplift their overall marketing performance.
If you’re just getting started with mobile attribution and marketing analytics, we recommend reading the following guide first
User acquisition – What to measure and set up
Before you even get started with setting up your UA campaigns, you must first have a few capabilities in place to guide your setup in the right direction. Let’s take a look at the essentials:
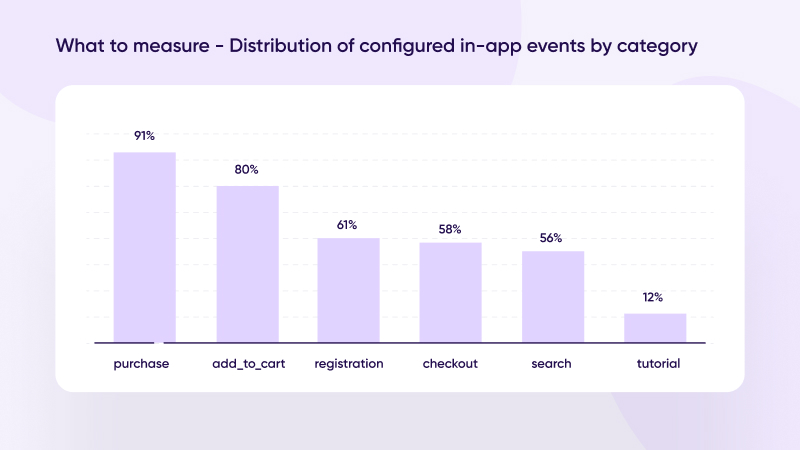
1. Event mapping
To begin discussing the importance of granular measurement for successful user acquisition, let’s take a deeper look at what that actually means in practice.
The following chart explores some of the main metrics savvy shopping app marketers measure to optimize their efforts, and deliver the highest-value users to their apps. The left column contains vertical-specific goals, while the right column contains the metrics through which these goals can be met.
Note that although all metrics above are important to improving the profitability of your shopping app, the top industry leaders focus specifically on Day 0 and Day 7 purchase amounts and rates, as well as Day 0 and Day 7 ROAS.
| Goal | KPI |
|---|---|
| Installs related • Acquisition • Cost | Organic/Non-organic split • Month over Month growth (non-organic) • CPI/CPA • ROAS |
| Engagement related • Stickiness • Short term loyalty • Long term loyalty | • DAU/MAU • Retention Day 1, 7, 28, and 30 • Week 8, week 12 retention rate • Uninstall rate day 7, 30, and 60 |
| Purchase related • Increase first time purchases • Increase repeat purchases • Increase average order value (AOV) • Share of retargeted user orders • Cancellations with negative revenue and/or purchases that are returned to origin (when a user demands money back | • Basket size • % of users making 1, 2, 3 or 4+ IAPs within 90 days • ARPU: Day 1, 7, 14, 30, and 90 • First week conversion rate (how many users make purchase within first week) • Time between 1st to 2nd to 3rd purchase • % growth of AOV between 1st purchase & subsequent purchases • First-time purchase vs. repeat purchases • Day 0, 7 and 30 purchases, unique user and event count – both cumulative & individual days |
| Funnel conversions | • % Install to Registration • % Install to Cart Add • % Install to Checkout • % Install to Purchase |
| Connecting the dots | • Unique new users (app brought in, did not interact with other touchpoints) • % of users who began journey on web and converted in-app • # of users purchasing on more than one platform • % of completed multi-platform conversions • Comparison of value of users on each platform • AOV per platform • % of users per platform |
The why and how of rich in-app events
The depth to which we can gather the right data in order to optimize campaigns towards high quality users, and boost engagement and revenue along the way, is significant.
That also means the amount of data we need to handle and analyze is massive, though with the right tech stack, setup, and attribution platform, marketing analytics can be made much easier.
But still… Why do I need to measure rich in-app events and other granular data?
Highly effective UA, engagement, remarketing — are all driven by building audiences and optimizing media sources, channels, campaigns, and creatives based on rich in-app events.
These events add layers of both available and measured parameters that map out ideal user behavior.
With the raw data you receive from a measurement and attribution provider, you will literally be able to see user trends and patterns you might otherwise miss, and get a complete picture of their activity and behavior, no matter the platform, channel, device, and the time at which they perform actions.
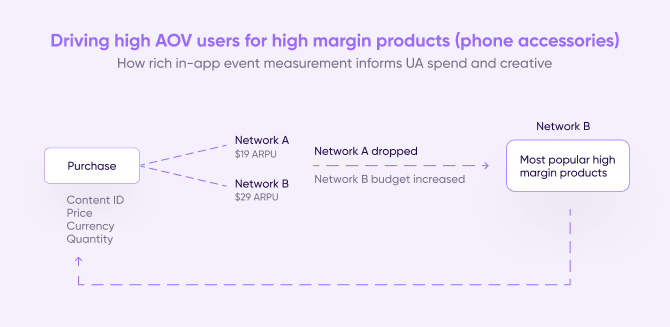
Let’s look at two examples to illustrate the difference between standard in-app events versus rich in-app events:
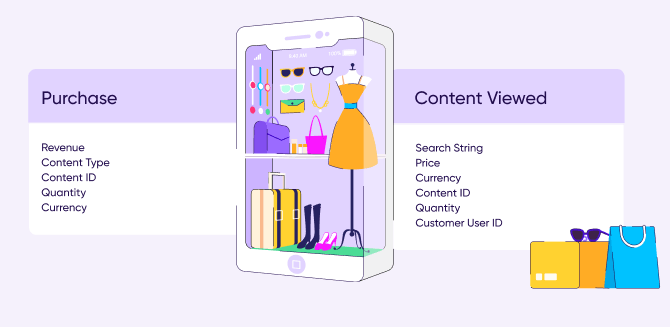
What was once simply a “purchase” now becomes a content type (e.g. red dress or bluetooth speakers), a specific content ID, quantity, currency, and even a revenue amount.
All of these parameters can then be sliced and diced to target audiences who behave similarly to current users who may view a specific type of content, have a specific cart quantity, or that have paid in a certain currency — in order to reach different demographics, regions, or valued purchasers.
The granularity of rich in-app events can also be applied to other events, such as Search, Content View, Sign-up / Login / Register, Add to Wishlist, or Add to Cart. This will be based on where in the conversion funnel you are attempting to engage or re-engage users, as well as your ultimate conversion goals.
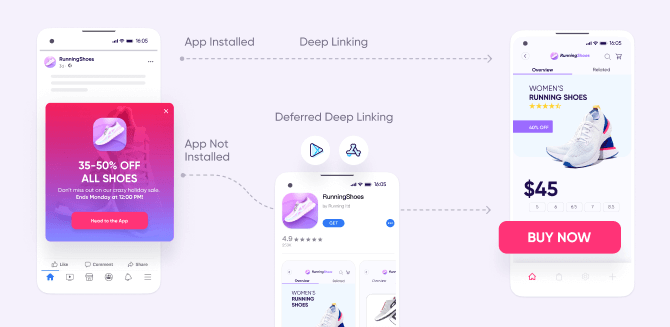
2. Deep linking

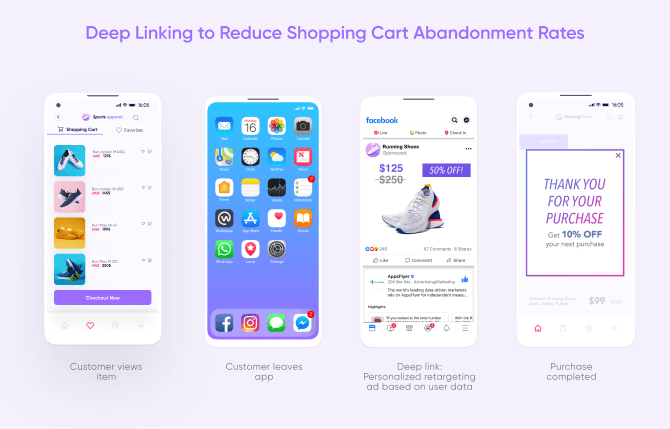
One of the most powerful tools in the app marketing tech stack is deep linking, creating a contextually-relevant user experience across channels, platforms, and devices. How is this done?
Using the information contained in the deep link, users are brought directly to a specific product or campaign landing page within an app, seamlessly moving from promotion to the app landing page with greater likelihood for conversion.
In the shopping vertical, deep links are most often used to drive customers to product pages based on previous viewing or purchase behavior.
You can route users to the app from desktop or mobile web, email for long-term retention, and communicate important deals and promotions to drive in-app conversion.
To get started, you must first configure deep linking. Luckily, this can be done easily by implementing code in your app, or through enabling associated domains, depending on the method used.
Also pay attention to the fact that deep linking is needed for both specific product pages, or product detail pages (PDPs), as well as broader category pages, or product listing pages (PLPs).
The destination to which a user is brought is primarily dependent on:
- The deep linking campaign goals
The consenting user information previously gathered (i.e. content viewed, purchase history, location, etc.), which must be decided and understood ahead of time.
For more information about deep linking and how it can dramatically affect CX, read our Return on experience guide
Advanced deep linking strategy
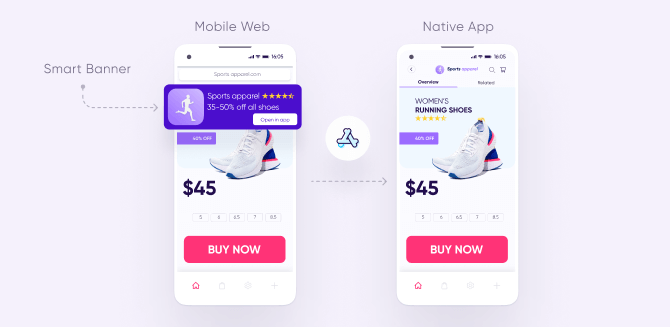
Well-rounded shopping app marketers use deep links to bring users specifically from mobile web to their apps using an ‘Open in App’ call-to-action smart banner.
These call-to-actions (CTAs) often go hand-in-hand with campaigns offering promotions and deals for in-app users. For example, a 5-10% discount for purchasing in the app rather than the website.
Through the deep links placed in these banners, marketers can bring users to install their app (if not yet already), get smoothly routed to the same product or category page previously viewed, and later to a checkout page for purchase.
But why would marketers want to reroute users to their app from mobile web in the first place? Simply put, the app is the ultimate destination because of the unmatched data insights and massive brand impact it can provide.
When a user clicks on a smart banner popup and follows it to a page in the app, you can receive data on the user’s subsequent in-app activities, the IDs of product and category pages visited, and even, retroactively, the attribution data from the user’s journey to your mobile website.
Beyond the valuable data gathered, however, smart banners also contribute to an improved user experience, increasing the potential of greater brand loyalty and engagement overall.
When choosing a deep linking solution, make sure that it not only supports your growth needs, but is also in sync with the latest privacy and security guidelines, and your campaigns comply with the most up-to-date user privacy and security regulations.
3. Uninstall measurement

It’s not enough to bring users smoothly to your app, and personalize their experience within it to optimize conversion rates. Marketers must also address the inevitable segment of users who will uninstall their app completely, and either build a strategy to bring those users back to active engagement, or exclude these users from future campaigns.
To do so first requires understanding why, when, and which users uninstall, especially given the rising scale of competition and higher user expectations.
So what are some of the things that can make users uninstall your shopping app?
- Poor in-app functionality and experience. Optimize your UA campaigns all you want, but it’s nothing short of critical to ensure you have a great infrastructure to support your app’s functionality, and ensure a flawless path to conversion.
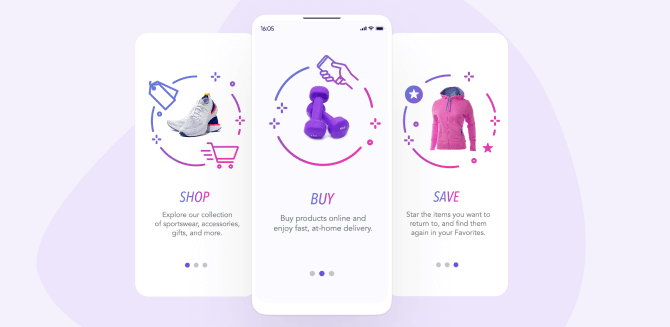
- Excessive or impersonal onboarding process. Ensuring that your users move as quickly and smoothly to active engagement as possible means building an onboarding process that is short, simple, and intuitive.
It should cover app basics and potentially even offer incentives. One option is to conduct registration or sign-in via a Facebook or Google account.
- Irrelevant or overwhelming notifications. Shopping apps may use push notifications to update users on new products, offer discounts or incentives, share general news, or simply bring inactive ones back to a potential purchase. But it’s also possible to overdo it.
Be intentional about sending only key notifications, at appropriate times, to users who display strong intent and relevant characteristics for each message. - Device storage and wifi network limitations. There is a greater frequency of uninstalls in developing countries compared to developed countries — due to device storage and wifi network coverage limitations in these regions. That said, these numbers are changing as cheap but high-end devices and 5G are being more widely introduced.
Given that users can uninstall your app for one or a combination of many reasons, it should be clear that understanding your app’s uninstall rate is important.
But what exactly are the main benefits of uninstall measurement for marketers? There are a couple:
1. Compare the overall quality of your media sources — by exploring the performance and retention of users from different media sources, campaigns, single ads, countries, etc.
2. Protect user privacy by removing uninstalled users from remarketing segments and discontinuing re-engagement messaging.
4. Fraud protection

Fraud is a massive concern, particularly for shopping apps — mainly due to their scale and relatively high CPI and CPA payouts. AppsFlyer studies show that it’s one of the hardest hit verticals, with a financial exposure to fraudulent installs that soared to $2.1 billion in 2021 alone.
Increased fraud attention has led to much stronger protection measures, which in turn led fraudsters to up their game with increasingly more sophisticated fraud tactics.
This is especially evident in the use of advanced bots that aim to mimic user behavior in an attempt to bypass protection, and a similar trend can be seen from device farms: physical ones with thousands of actual devices on racks, and virtual ones with the use of emulated devices.
Given the continued resurgence of bots and increasingly more advanced fraud tactics, real-time protection should actively flag behavioral anomalies, subsequently unmasking new bot signatures and otherwise undetectable fraud behavioral patterns.
A good anti-fraud solution is therefore a blend of supervised and unsupervised machine learning driven by a large scale of data.
And since fraud is an ever-evolving threat, this means that not all of it can be identified in real time. New fraud patterns, model modifications, and variations constantly appear, as fraudsters try to gain the upper hand.
Post attribution fraud analysis is therefore necessary, as it provides a much needed retrospective look at installs that were attributed and were not identified as fraud in real time.
For more information about how AppsFlyer uses both machine learning and big data to combat fraud, read here.
Advanced protection
One common misconception is that CPA-modeled shopping app campaigns experience little to no fraud due to the lack of install-focused incentive, or the difficulty of generating an in-app event / purchase for fraudsters.
That simply is not true. For this reason, savvy marketers look at any and all of the following measurements:
Cancellation rate
The ratio of cancellation events to installs is highly relevant to advanced fraud detection.
In CPA fraud, an ad network (or one of its publishers or sub-publishers) places an order, receives the CPA payment, and later cancels the order. Unfortunately, this behavior is legitimate, since most eCommerce platforms allow cancellations for a certain period if clients are not satisfied or if the product is damaged, etc.
Since there is usually a steady cancellation rate for most apps, higher rates from specific media sources or site IDs typically signal that these orders are not genuine and only exist to collect CPA payouts.
To minimize damage, shopping app marketers should negotiate a penalty clause for networks in lieu of fraudulent activity directly in the contract.
Install-to-purchase time
For shopping apps, there tends to be an acceptable limit in the time between an install and purchase. Less than that is cause for suspicion. Because each app’s needs are different, however, it’s suggested to use attribution data to understand that limit on an individual basis and create boundary conditions accordingly.
5. Mapping a holistic customer journey
The reality is that a significant divide between user behavior and marketing measurement still exists in our day and age.
On one hand, shopping end users have increasingly more complex conversion journeys involving multiple devices and touchpoints — desktop web, mobile web, apps, and even in stores.
The difficulty with understanding the complex path to conversions remains a stumbling block for marketers. In fact, according to research by eMarketer, cross- device attribution is the second biggest (42%) challenge for media professionals.
Marketers therefore need to use multi-touch attribution (MTA) when mapping the customer journey and building their marketing strategy.
MTA is a marketing measurement method that takes multiple online and offline touchpoints along the customer journey into account, and then assigns credit to each based on varying logic per business.
There are many different MTA models (linear, U-shaped, W-shaped, full path etc.), all of which have their own merits and limitations. What’s crucial is that they factor in the influence of different touchpoints and assign due credit to each.
Doing so helps marketers understand the impact of each touchpoint and identify which are delivering the highest value.
For more information about MTA read our blog Multi-touch attribution: Success is a journey
6. Incrementality

Incrementality gives you the necessary insights to determine the real value of your marketing efforts. This is done by measuring which conversions were the result of a specific campaign, and which would have happened organically on their own.
Bear in mind that proper incrementality testing could be a long and complicated process, prone to poor execution and interpretation. It requires knowledge, expertise, and a robust testing environment to ensure that the right insights are derived and the right decisions are driven.
One of the quality signs you should be looking for in an incrementality solution is the ability to offer a full integration between measurement and segmented audiences.
This will allow you to streamline the whole process of creating and managing your test campaigns, and free you to focus on the end-goal of your tests without having to worry about the heavy lifting that comes with it.
To learn more about how incrementality testing can help you prove the real value of your campaigns, click here.
7. Predictive analytics

Predictive modeling helps marketers understand consumer behaviors and trends, anticipate future actions, and plan campaigns based on data-driven decisions.
With privacy (or lack of) taking center stage, the average app user is no longer in a hurry to share their data in order to use an app. But, nowadays, are advertisers really left in the dark when it comes to access to quality data?
The short answer is no. By incorporating predictive modeling into their tech stack, marketers can make informed decisions while upholding the strictest user privacy standards.
By leveraging machine learning and AI to examine historical campaign data, past user behavior data, and additional transactional data — predictive analytics are a powerful tool that allow you to make real-time campaign optimization decisions without missing a heartbeat, nip unsuccessful campaigns in the bud, or quickly double down on investments that can drive even better results.
Creating different behavioral characteristic clusters allows your audience to be categorized not by their actual identity, but by their interaction with your funnel in its earliest stages. Offering you their future potential to drive meaningful value to your product.
Even with limited access to granular data, you can leverage predictive analytics to:
- Increase your campaign’s potential audience
- Drive higher LTV
- Ensure more efficient budgeting
User acquisition – 7 Best practices for effective user acquisition
1 – Day 7 and 30 cohort analysis
With pressure high in the eCommerce space, as well as demand for continuous optimization of their marketing spend, marketers turn to Day 7 and 30 cohort analysis reports to check the number of purchasers acquired 7 or 30 days after install.
You can use these reports to measure the effectiveness of any new media source:
2 – Long term ROI
In addition to day 7 and 30 cohorts, check cohorts and LTV for the long term to detect high quality media sources and users. For example, media source A may drive many purchasers in the first 30 days but then showcases a low repeat purchase rate.
Conversely, media source B may drive less purchases in the first 30 days, but deliver overall a higher number of repurchases — to the point of generating a higher ROI than source A.
Only analyzing the performance from the day 7 or 30 cohorts may mean missing these higher quality users. Remember that LTV measurement is a weak point when it comes to SKAdNetwork, which means advertisers need to dedicate some of the conversion values to measuring longer term KPIs.
3 – Seasonal shopper audience
Some of your users may only shop during holidays, given the increased availability of sales and incentives during that time. During your next holiday sale, focus your remarketing efforts on seasonal-only shoppers, or users that bought over the last holiday — in order to convert them to regular engagement.
4 – UA vs. CPI/CPM
To take full advantage of shopping app demand and save more for your marketing budget, it’s best to time larger user acquisition investments with periods of lower acquisition costs, and fewer CTAs for customers to deal with.
For example, September often sees all-time low costs and high install-to-purchase rates, meaning users are more likely to install and convert given well-placed, but not overbearing, UA efforts.
5 – Personalize, personalize, personalize
Especially critical to retail apps, personalization of your UX should be a priority, both in and out of the app. Emphasize a contextually relevant onboarding process that encourages users to create a profile and set their own preferences.
When applicable, you can also use granular in-app event data to populate the home screen with items similar to previously purchased brands or styles for greater upsell and cross-sell opportunities.
6 – Audience segmentation
After gathering data about your consenting users’ pre- and post-install activity, it’s important to move from insight to action and prepare specific audience segments that will define your most valuable users and then serve as a basis for future acquisition.
Audiences can and should be used for many purposes. For example, as a shopping app, you might:
- Build lookalike audiences. Improve your user acquisition by focusing on prospects who “behave” like your best users — e.g. those that purchased more than 3 times in the last 30 days.
- Segment based on exclusion parameters. Remove users that you’re reaching out to on Network A, and would not like to reach out to on Network B. Or, create an audience segment of inactive users and exclude them from your re-engagement campaigns.
7 – Increasing ATT opt-in rates
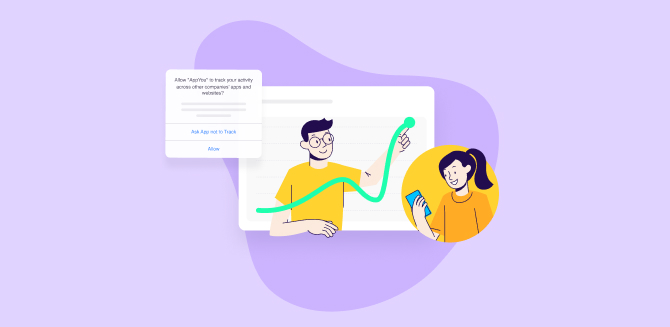
So far, ATT opt-in rates have been higher than many initially thought prior to the iOS 14.5 rollout, and currently range at around 47% on a global scale (see interactive dashboard).
Here are 5 ways to increase your ATT opt-in rates, and reap the rewards of greater quantities of user level data and attribution:
1. Customize the purpose string in the ATT prompt
Although the first part of the text string in the ATT prompt is set in stone by Apple, you do have scope to customize the second part — a move you should absolutely make. This is your chance to allay any fears users may have over privacy concerns, and explain the value of opting in.
2. Use a pre-ATT prompt for additional context
A pre-ATT prompt is ideal for giving users the extra information they need. It’s a chance to contextualize what you’re about to ask of them, why you’re doing it, and what’s in it for them.
3. Use a post-ATT reminder
For users who decline to give permission at the ATT prompt, it doesn’t need to be the end of the road. They can still enable permission tracking at any time (and disable it again, if they wish) in their device’s Settings.
Your users might not know this, so — this is your chance to give them a reminder. As with the pre-ATT prompt, show engaged users a post-ATT reminder that includes the user benefits of opting in. This prompt can then take them directly to their settings to opt-in to your app.
As to intake, we saw that 30% of non-gaming apps had a higher opt-in rate 7 days after installations using this method.
4. Timing
You have control over when to show the ATT prompt (or if to show it at all) – and your decision can have a massive impact on opt-in rates.
Showing the ATT prompt upon first launch leads to 30% higher IDFA compared to showing it two hours later. Clearly, uur data indicates that opt-ins are highest when users launch the app for the first time, especially when it’s shown after pop ups like notification settings.
However, your app is unique and should still be tested. It’s likely that as users progress through their journey funnel, they’ll become progressively more engaged. On the one hand, these users should be more likely to opt-in if shown the prompt later in the funnel, but on the other— your overall audience size might reduce by then due to churn.
5. Strong brand affinity leads to user trust
Trust is a crucial factor in ATT opt-in, just as it is in any brand-consumer relationship. Simply put, the more a user trusts your brand, the greater their willingness to opt-in and allow use of their data.
Re-engagement – What to measure and set up
Having a successful shopping app is not only about acquiring new users and driving them to conversion. It’s also about making sure those who arrive remain engaged over time, ultimately driving revenue, repeat purchases and boost lifetime value.
This is especially true for shopping apps, who must not only bring lapsed users back to the app to drive the first purchase, but also re-engage users before they lapse (usually within the week after install, known as the “7 day slump”) in order to maximize long-term retention.
In fact, the numbers show that re-engaged shoppers who are re-engaged after acquisition are 30% more likely to remain engaged and perform in-app purchases on their own. That’s a significant difference for revenue and success.
What about privacy, you ask? It’s true that Apple’s privacy-driven approach has had a significant impact on the app ecosystem.
Nowadays, mobile app marketers need to rethink how to measure, attribute, and optimize their campaigns in the face of limited data for targeting and optimization, and the need to rely on aggregated data instead of user-level data.
Above all, these changes are pushing advertisers to make a much needed mindshift from the old way of measuring their campaigns — to adopting a new framework.
Moving aways from the user-level data-centered technologies we’ve all gotten used to, and onto the likes of SKAdNetwork, user-level deterministic attribution, aggregated probabilistic modeling, predictive analytics, top-down measurement (e.g. incrementally and media mix modeling), and even Data Clean Rooms.
1 – What to measure
Below are the main metrics top shopping apps include in effective re-engagement. You can see that the left column contains vertical-specific goals, while the right column contains the metrics that would indicate and drive these goals.
| Goal | KPI |
| First purchase | • Number and share of first purchases driven by retargeting • ARPU & ROAS |
| Repeat purchases | • # of repeat purchases driven by retargeting • ARPU & ROAS |
| Re-activations | • # of lapsed users reactivated |
2 – ROX, deep linking, and great CX

We addressed earlier the why and how of deep linking in acquisition, but in the shopping vertical, deep linking is just as, if not more, vital for re-engagement and remarketing.
For shopping apps that tend to have longer and higher-value conversion cycles, it is easy for users to become inactive, or even uninstall, before, and sometimes after a single purchase.
Marketers must therefore be especially proactive and keep users steadily engaged after install, rather than face the more difficult task of trying to win them back after leaving.
Deep linking is also often used in conjunction with email, given that this messaging more critically requires personalization of both content and added links.
For example, emails with deep links embedded in CTAs leading to category X’s product page — might be sent to users who visited category X in the app, but did not purchase.
Likewise, for users who did purchase from category X, a deep linked email might bring this segment to product pages that pair well with category X, and so on.
Deep linking allows marketers to increase conversions by creating awesome, easily-created customer experiences that drive new and existing users to their app — from any channel.
By offering great CX, they’re able to take more users to their desired destination and widen the bottom of their funnel. Product managers, on the other hand, can leverage deep linking to better engage and retain their users.
Great CX leads to business results, and the business impact resulting from investment in customer experience is known as return on experience (ROX).
To learn more about ROX and how it can propel your app engagement forward, have a look at our ROX guide.
3 – Owned media

Owned media is any marketing asset directly controlled by a company and which requires little to no additional cost to access and use. Most relevant to mobile re-engagement are push notifications, emails, and SMS messages, but also webinars and tweets.
Owned media is your way of creating free, contextual content designed to increase engagement on your active, idle or lapsed users’ side — and create a more personal, long-lasting connection. In the age of user privacy, where user-level data is harder to come by, this connection is nothing short of critical.
Let’s explore this process. Usually, marketers have a CRM which enables the use of such campaigns. These CRMs receive data in two ways: either through their own SDK, or through an attribution and measurement provider.
The latter typically has pre-built integrations with the most popular tools worldwide, allowing marketers to export their data directly.
Imagine that a user added 3 items to the cart but didn’t make a purchase. Based on these in-app events, the marketer runs both a push and email campaign, but there is still no conversion. At this point, the marketer would typically begin remarketing via paid sources in an attempt to convert the user.
If the marketer is savvy, they will use different parameters to run diverse campaigns on push, email, and paid channels.
For low ticket value items, push and email makes complete sense given they’re practically free. For high ticket value items, however, marketers will also remarket using paid media on top of their owned media initiatives.
Interestingly, despite their widespread use, many marketers are still not fully aware of the long term value owned media channels inevitably provide.
Why leverage owned media?
- Utilizing the marketing “hierarchy” – Given the little to no cost of owned media channels, especially compared to paid campaigns, re-engaging users via these channels should be the focus and priority as much as is possible and appropriate.
- Full control over every aspect of your content.
- It’s free – aside from the internal resources you’ve put in to create it.
- Low risk – with paid media you could find you’ve wasted your budget if a campaign proves to be unsuccessful, and with earned media (the equivalent to digital word of mouth) you lack control over comments or potential inaccuracies. Owned media avoids both completely.
- Contextuality – owned media allows you to build content strategy that addresses each stage of your user journey, including your uninstallers or dormant users.
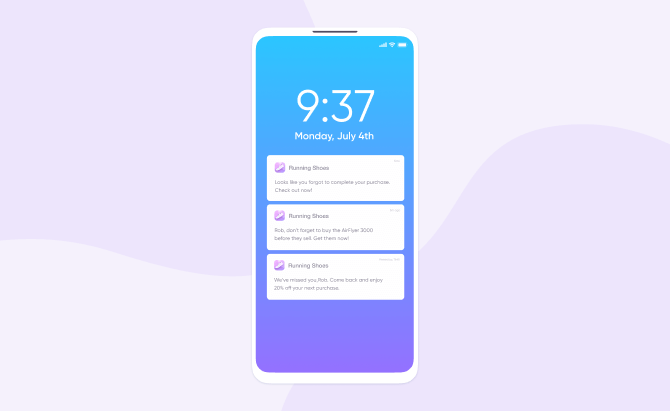
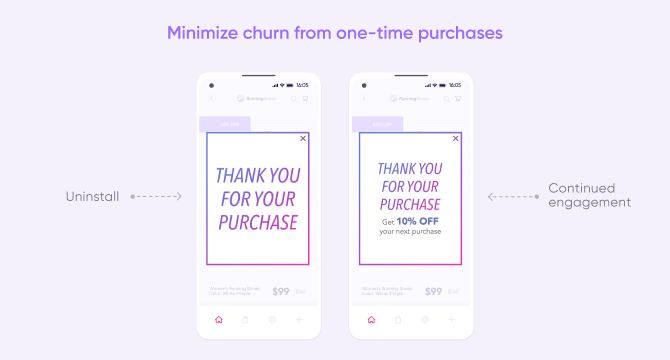
4 – Remarketing
Because shopping apps face longer and higher value conversion cycles, re-engaging lapsed or uninstalled users (or at times excluding uninstallers from these campaigns) is necessary for ensuring long-term retention and lifetime value.
Additionally, given the challenge of increasing UA costs, it’s cheaper to proactively re-engage your existing users rather than acquire those that are lapsed or new.
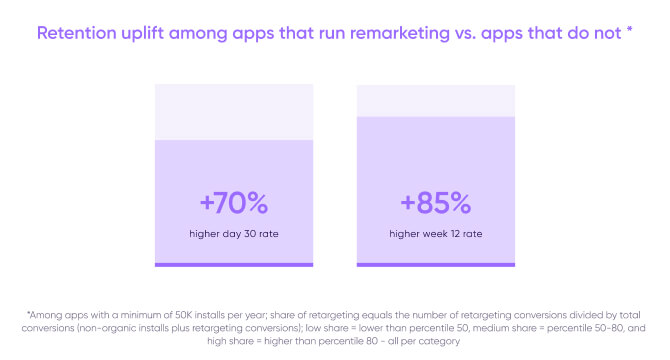
In fact, according to data, there’s a 70% higher day 30 rate among apps that run remarketing campaigns vs. apps that do not.
Timing remarketing campaigns
Deciding when to start running remarketing campaigns depends on multiple factors, such as the type of audience segment, the level of engagement, whether you’re seeking to recover users or simply re-engage, your budget, and others.
Remarketing campaigns may be launched as early as immediately or 24 hours after install, within the first week, or later. There is no one-size-fits-all formula.
Stopping your campaign also depends on several factors, not the least of which are your expected marketing goals and the limits of your campaign budget. In the shopping vertical, marketing experts tend to end campaigns after 7, 14, and 30 days, though one perspective says that all likely activity will occur within 14 days.
It’s therefore important to ensure that, however long you run your campaigns for, be sure to stop them within a reasonable amount of time and avoid wasting budget (excluding evergreen campaigns).
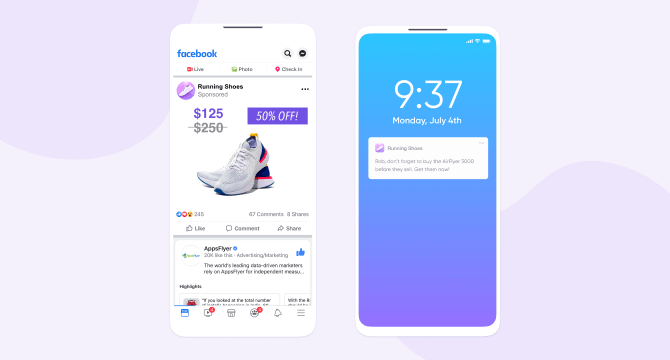
Dynamic ad remarketing
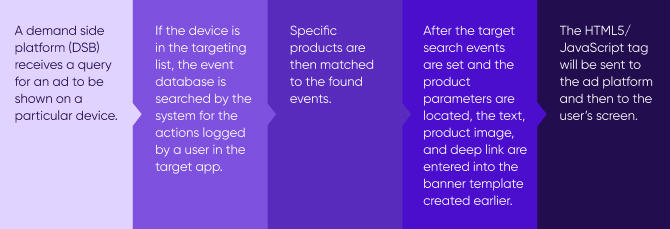
Dynamic remarketing ads take existing user data and use it to serve users contextually relevant ads, whether of products already viewed or those that are similar to their interests. Launching dynamic ads requires the ability of your platform to sync with the following data:
- Event database
Information about the targeted product - Product feed
Information about products, brands, prices, images, and product page links - Advertising server
Hosts dynamic content and generates an HTML5 banner
Dynamic ads are part of a real-time bidding process (RTB), that takes place within a lightning fast 100 milliseconds, to be exact, in which:
Once properly set up, the benefits of dynamic ads are significant. On the one hand, the rich media creative of these ads is 20% higher than standard banners, but is ultimately more cost effective due to the CTR and conversion rates.
Dynamic ads also allow marketers to display multiple relevant products or services, avoiding the need to choose if a user has expressed intent.
Re-engagement – Best practices for effective remarketing
1 – Personalization – not just for UA
With the sophistication of marketing tech and the volume of apps exploding, app users, especially in eCommerce, expect customized experiences from start to finish.
Use purchase or view histories to cross-sell and upsell lapsed users. Pair deep links with other in-app event data to reduce shopping cart abandonment rates.
Choose ad partners that offer behavior or intent personalization and make this process part of your marketing routine.
2 – preventive remarketing
Remarketing campaigns should not only prioritize the classic lapsed users, but also function preventatively to keep users engaged before they actually jump ship.
If effectively engaged via remarketing campaigns within the first week after install, users are nearly 30% more likely to remain engaged and convert. However, be sure to limit preventative remarketing campaigns to engage without overwhelming.
3 – Simultaneous creative testing
When it comes to optimizing ad and creative performance, testing 3-5 different creative sets simultaneously will provide the most profound performance analysis within a reasonable and efficient time period.
However, as a general rule, it is better to test several different creatives more frequently than to perform tests on large amounts of creative sets at the same time.
4 – Long-term LTV segmentation for remarketing budgeting
To determine the quality of your re-engaged users relative to your goals, create LTV segments for days 30 and 60, measuring for long term value and revenue.
Since 30 days is the likely maximum cap for most purchases, these segments will also help you test whether or not to re-engage within this 30 day period (if not, then no remarketing will likely occur after 30 days).
Remember that the remarketing window for larger shopping brands is likely to be longer than for smaller brands.
5 – Reattributed vs. new users
Understand the user-level value of your reattribution efforts by comparing reattributed users to new users.
There are two main quality metrics to measure, ARPU and frequency of purchases, which are analyzed in windows of either 30, 60, and 90 days, respectively. This comparison can also be used to determine remarketing spend.
6 – Re-engagement and audience segmentation
As in acquisition, your granular in-app event user data can be directly applied to create audience segmentations for re-engaging users.
Push notifications, emails, and other owned media are most often used first in re-engagement campaigns — given their low costs and ability to reach users more easily than paid methods.
Below are some examples of audience segments for re-engagement:
Remarket and re-engage
Improve your re-engagement by targeting high-value users who, for example, made multiple purchases last month, but were inactive this month.
Recover uninstalled users
Target users who made a purchase above $50 but who recently uninstalled your app, using custom creative to drive re-installs.
Cross-sell and upsell
Encourage users with high-purchase intent to complete checkout on items within the same brand or category as others added earlier to the cart.
Remarketing exclusion
An audience who has engaged with a specific owned media source (push, email, SMS, other) should be excluded from paid retargeting.
Category mixes
If you own a shopping platform selling multiple brands, optimize the brands displayed to high-paying users to drive more purchases of your most profitable brand(s).
Use audience segmentation to find the users that aren’t already buying these brands and engage target them.
Another important use of audience segmentation is the creation of split audiences for determining the incremental performance and growth of each media source, as well as performing A/B testing and pushing product features.
For the purposes of incremental and A/B testing, these split audiences can be based on the following factors, among others:
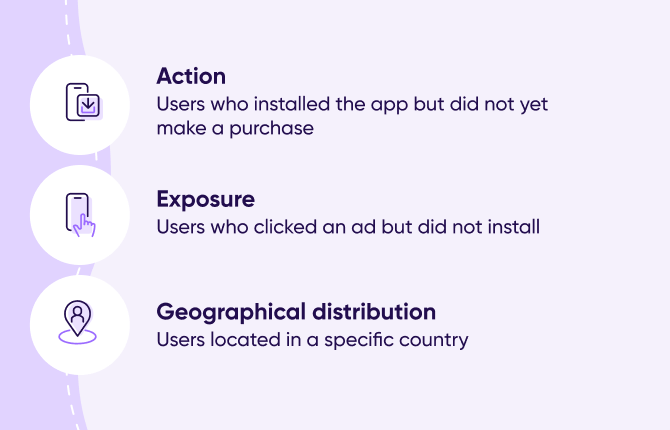
With incrementality and A/B testing, you can create two groups of users —, a test and control —, across different networks, and see which network, campaign, ad, and/or creative results in a more positive business impact.
Likewise, incrementality testing informs whether or not adding a new network to your existing portfolio can have a true incremental impact.
Final thoughts
In this stage of overall shopping growth, and despite limited access to user-level data, retailers have more factors on their side than less to reach their business goals.
A pandemic-accelerated mobile explosion and a growing demand from consumers to save both time and money — has driven a rise in technologies which have greatly enhanced the shopping experience across platforms, without compromising users’ privacy.
It’s now easier than ever to make purchases via mobile devices and, combined with promises of increasingly faster connectivity, eCommerce marketers are well-positioned to advance.
Facing this growth, the bottom line takeaway is the importance of granular measurement to carry marketers forward. Follow the suggestions and metrics as detailed above, and you will build the foundation for future profitability, performance, and success.